- MBAVPRCH Index (Released 7:00 EST)
- MBAVREFI Index (Released 7:00 EST)
- Challenger Job Cuts YoY (Released 7:30 EST)
- Challenger Job Cuts by Region TABLE (Released 7:30 EST)
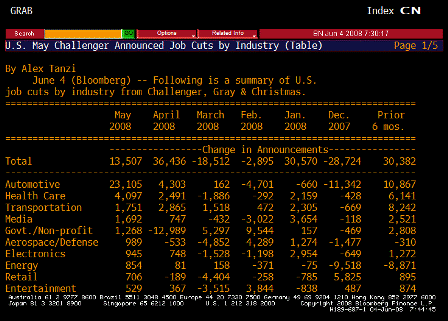
- Challenger Job Cuts by Industry TABLE (Released 7:30 EST)
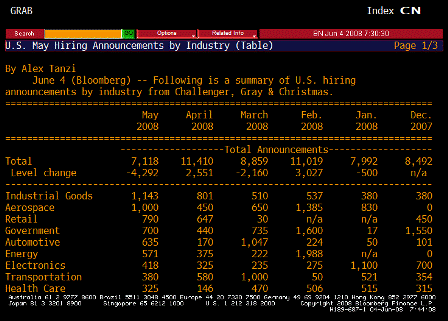
- US Hiring by Industry (Released 7:30 EST)
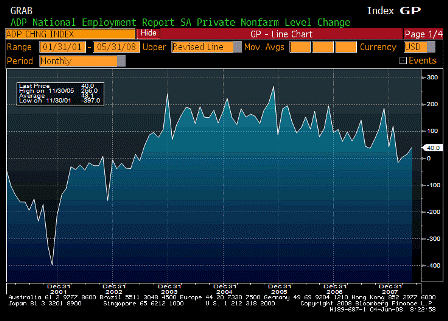
- ADP Employment Change (Released 8:15 EST)
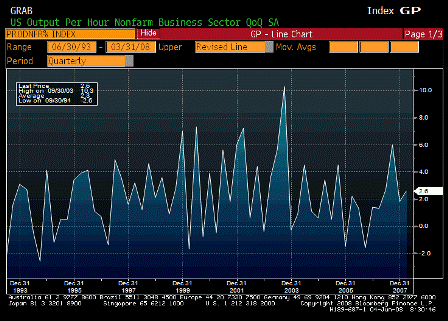
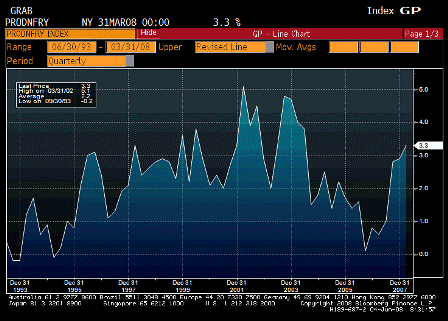
- Nonfarm Productivity QoQ (Released 8:30 EST)
- Nonfarm Productivity YoY (Released 8:30 EST)
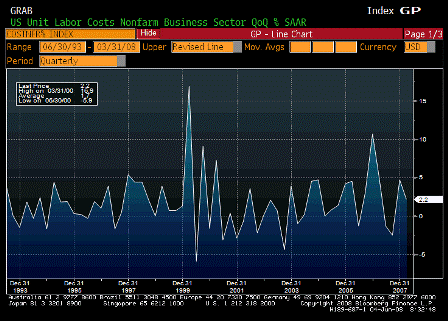
- Unit Labor Costs QoQ (Released 8:30 EST)
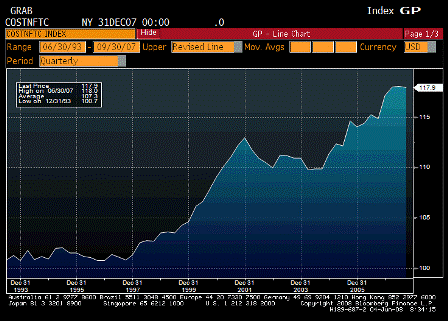
- Unit Labor Cost per Unit (Released 8:30 EST)
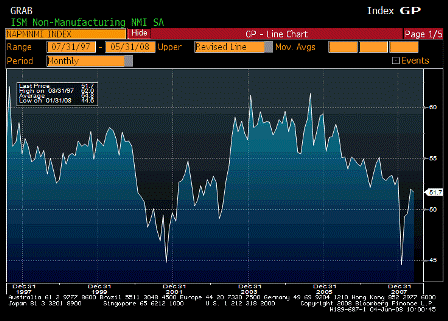
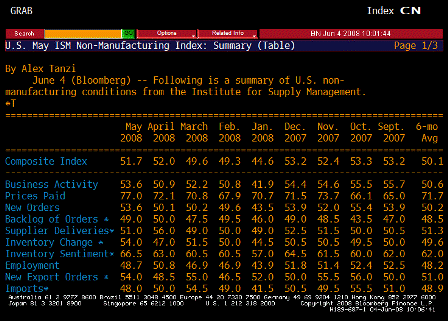
- ISM Non-Manufacturing Composite (Released 10:00 EST)
- ISM Non-Manufacturing TABLE (Released 10:00 EST)
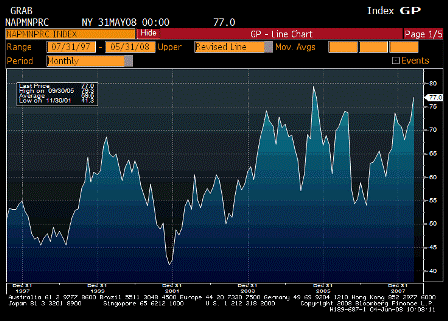
- ISM Non-Manufacturing Prices Paid (Released 10:00 EST)
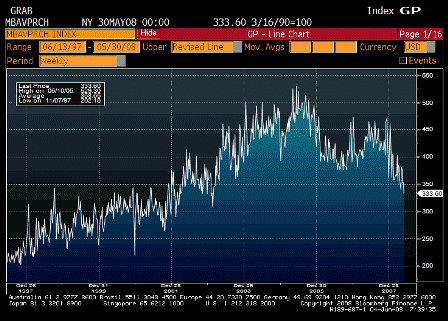
MBAVPRCH Index (May 30)
| Survey | n/a |
| Actual | 333.6 |
| Prior | 352.7 |
| Revised | n/a |
Not looking good, as the ‘old consumption economy’ – cars, houses, etc.- gives way to the new export economy with the allocations coming via ‘price’ as higher food/fuel prices take away domestic spending power and the foreign sector scrambles to spend it’s now unwanted multi $trillion hoard on US goods, services, and domestic assets, and keeps GDP muddling through.
First, probably fighting strong seasonals.
Second, purchase applications fall off doesn’t jibe with recent housing data and confidence numbers that have been rebounding.
Third, mortgage bankers could be continuing to lose market share to banks and other direct lenders as secondary markets remain problematic.
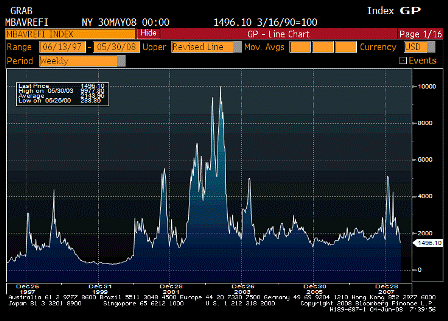
MBAVREFI Index (May 30)
| Survey | n/a |
| Actual | 1496.1 |
| Prior | 2013.5 |
| Revised | n/a |
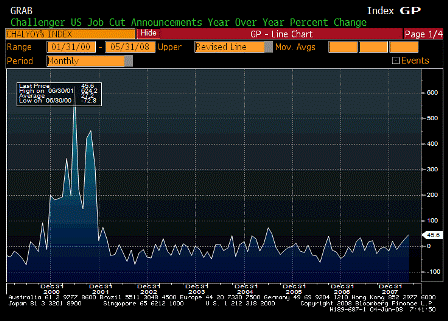
Challenger Job Cuts YoY (May)
| Survey | n/a |
| Actual | 45.6% |
| Prior | 27.4% |
| Revised | n/a |
Moving up. This hasn’t been much of an economic indicator, but employment is a lagging indicator and it makes sense for it to keep getting worse for a couple of quarters or so past the bottom of the cycle.
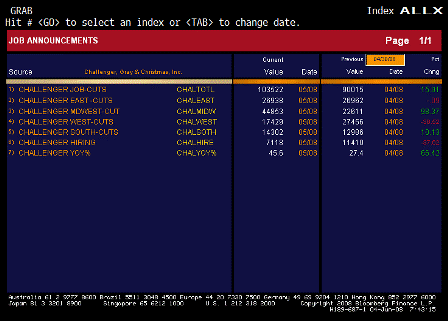
Challenger Job Cuts by Region TABLE
Challenger Job Cuts by Industry TABLE
Hiring
ADP Employment Change (May)
| Survey | -30K |
| Actual | 40K |
| Prior | 10K |
| Revised | 13K |
This report is private sector only. Government employment may be ticking up as we approach the election, as spending delayed from 2007 kicks in.
Nonfarm Productivity QoQ (1Q F)
| Survey | 2.5% |
| Actual | 2.6% |
| Prior | 2.2% |
| Revised | n/a |
Nonfarm Productivity YoY (1Q F)
| Survey | n/a |
| Actual | 3.3% |
| Prior | 2.9% |
| Revised | n/a |
Unit Labor Costs QoQ (1Q F)
| Survey | 2.0% |
| Actual | 2.2% |
| Prior | 2.2% |
| Revised | n/a |
Unit Labor Cost per Unit (1Q F)
| Survey | n/a |
| Actual | 117.9 |
| Prior | 118.0 |
| Revised | n/a |
ISM Non-Manufacturing Composite (May)
| Survey | 51.0 |
| Actual | 51.7 |
| Prior | 52.0 |
| Revised | n/a |
Another better than expected report. Clearly above recession levels, and supporting forecasts for higher GDP this quarter.
ISM Non-Manufacturing TABLE
Most categories noticeably stronger. Employment down some, but the average of the last few months is rising. New Exports Orders back up as well.
ISM Non-Manufacturing Prices Paid
| Survey | n/a |
| Actual | 77.0 |
| Prior | 72.1 |
| Revised | n/a |
This is getting ‘out of control’ from the FOMC’s point of view.
[top]

