- ICSC-UBS Store Sales YoY (Released 7:45 EST)
- Redbook Weekly YoY (Released 8:55 EST)
- ICSC-UBS and Redbook Comparison TABLE (Released 8:55 EST)
- Richmond Fed Manufacturing Index (Released 10:00 EST)
- Richmond Fed Manufacturing Index ALLX (Released 10:00 EST)
- OFHEO House Price Index MoM (Released 10:35 EST)
- OFHEO House Price Index YoY (Released 10:35 EST)
- OFHEO House Price Index TABLE (Released 10:35 EST)
- ABC Consumer Confidence (Released 17:00 EST)
- ABC Consumer Confidence TABLE (Released 17:00 EST)
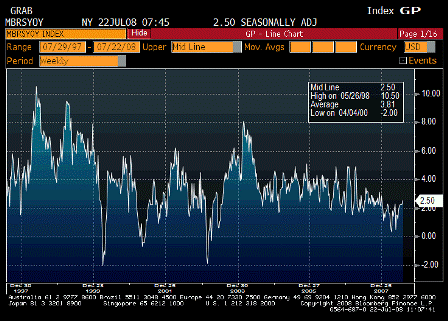
ICSC-UBS Store Sales YoY (Jul 15)
| Survey | n/a |
| Actual | 2.5% |
| Prior | 2.2% |
| Revised | n/a |
Still wiggling their way higher as fiscal kicks in.
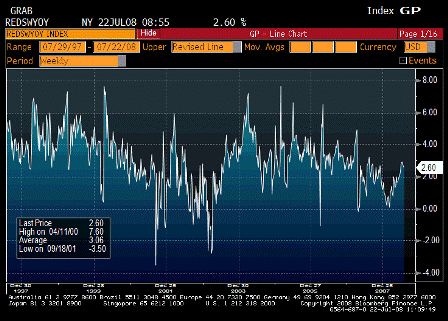
Redbook Weekly YoY (Jul 15)
| Survey | n/ |
| Actual | 2.6% |
| Prior | 2.7% |
| Revised | n/a |
Also working its way higher.
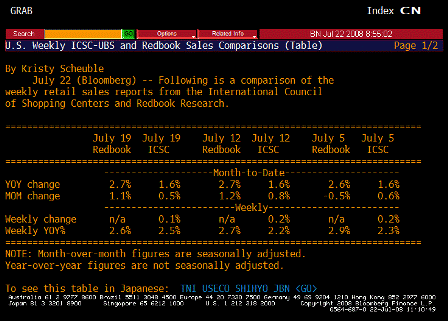
ICSC-UBS and Redbook Comparison TABLE (Jul 15)
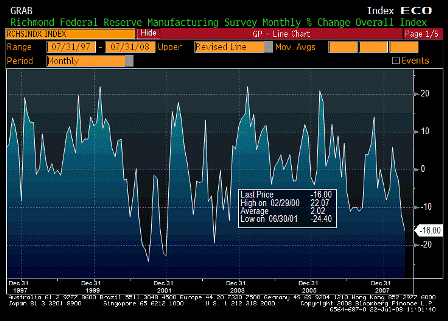
Richmond Fed Manufacturing Index (Jul)
| Survey | -9 |
| Actual | -16 |
| Prior | -12 |
| Revised | n/a |
Big dip puts it back on its downtrend.
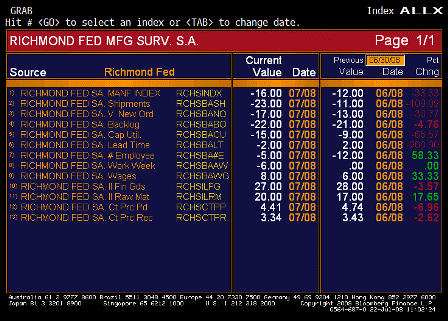
Richmond Fed Manufacturing Index ALLX (Jul)
Big drop in shipments,
interesting up tic in wages.
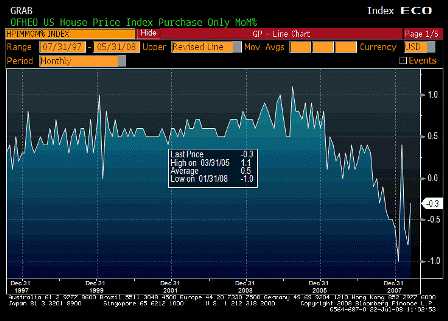
OFHEO House Price Index MoM (May)
| Survey | -0.8% |
| Actual | -0.3% |
| Prior | -0.8% |
| Revised | n/a |
Better than expected, still down, but seems to be falling at a slower rate.
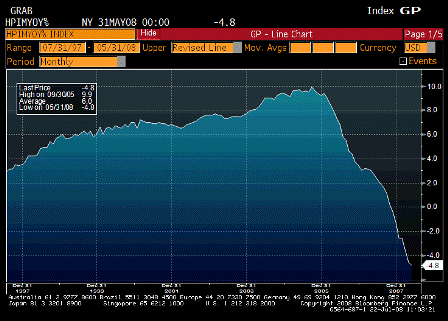
OFHEO House Price Index YoY (May)
| Survey | n/a |
| Actual | -4.8% |
| Prior | -4.6% |
| Revised | n/a |
Rate of decline seems to have diminished some. So far, year over year changes for this price range doesn’t seem that severe.
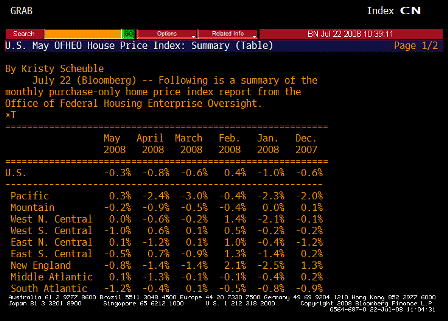
OFHEO House Price Index TABLE (May)
Several regions showing gains.
Unless commodities take a very large dive, the Fed needs an output gap in housing to keep a lid on overall prices.
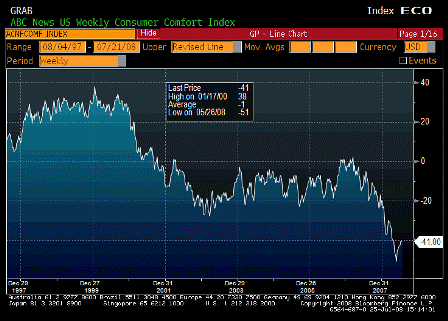
ABC Consumer Confidence (Jul 20)
| Survey | -42 |
| Actual | -41 |
| Prior | -41 |
| Revised | n/a |
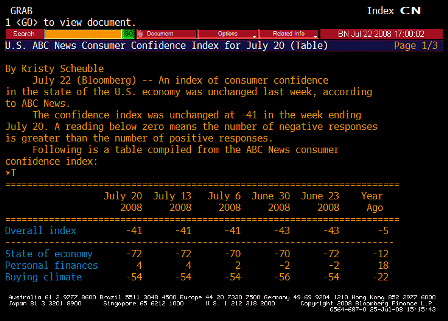
ABC Consumer Confidence TABLE (Jul 20)
[top]


