[Skip to the end]
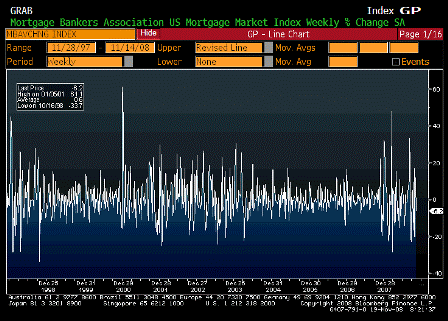


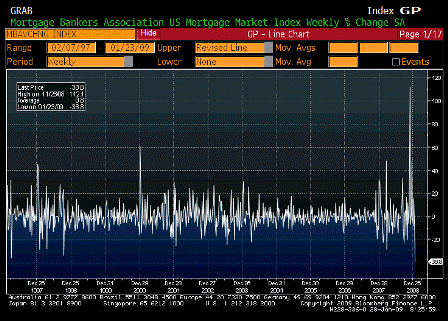
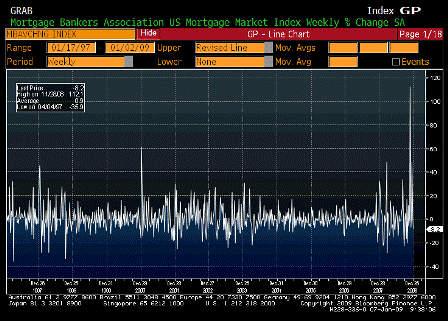
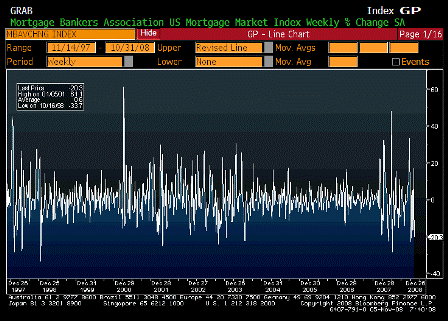
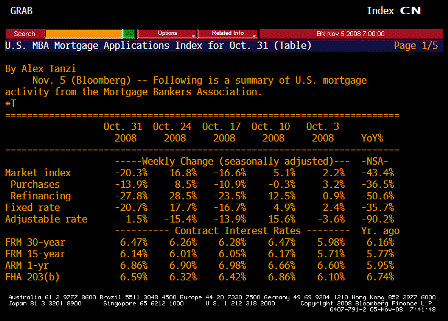
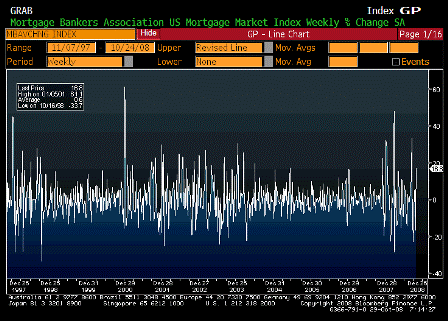
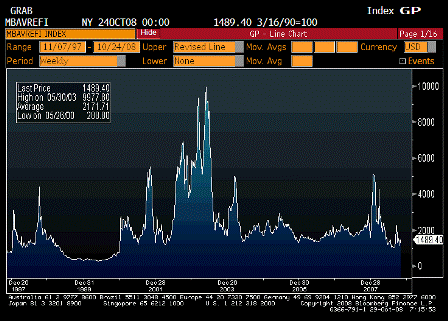
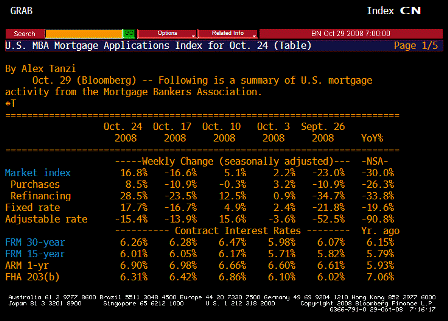
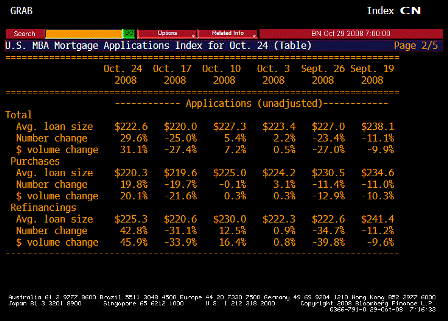
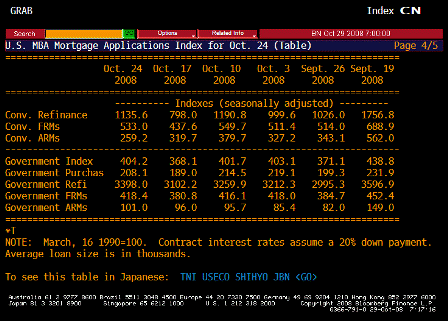
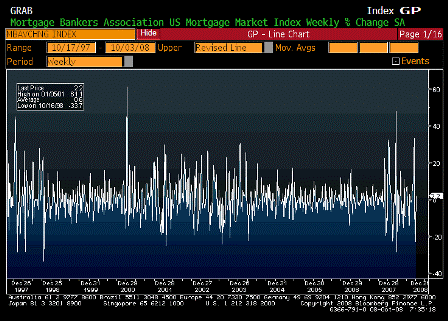
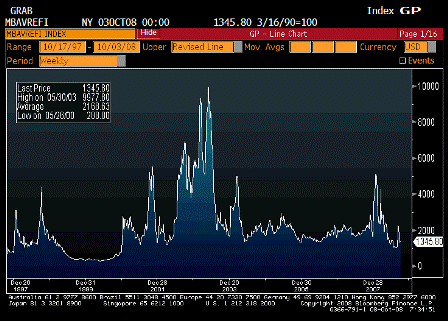
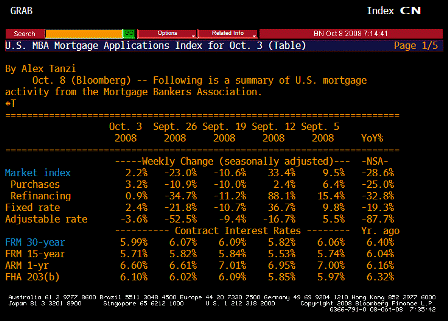
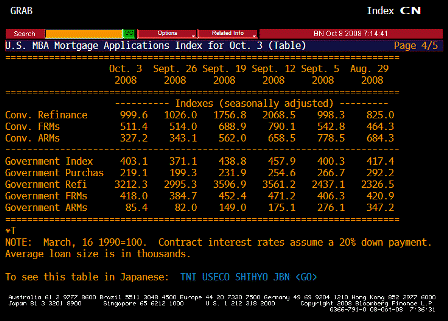
MBA Mortgage Applications (Nov 14)
| Survey |
n/a |
| Actual |
-6.2% |
| Prior |
11.9% |
| Revised |
n/a |
[top][end]
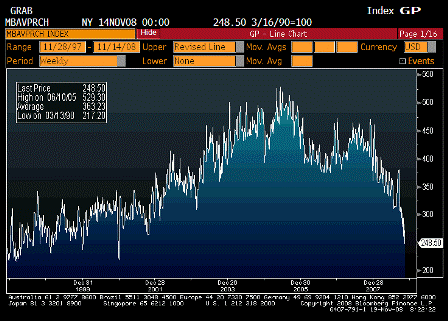


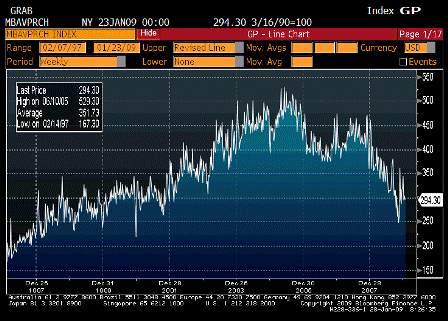
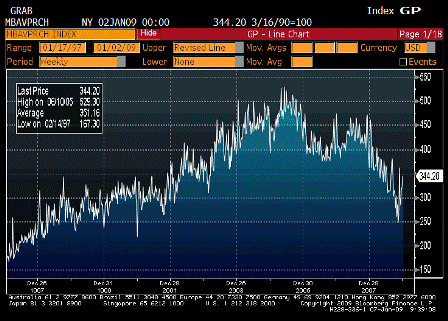
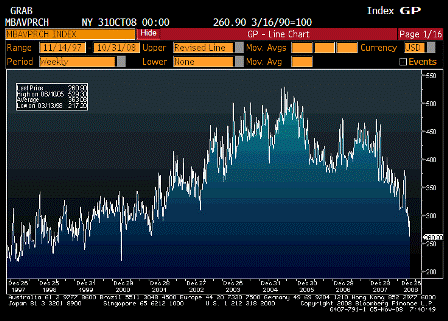
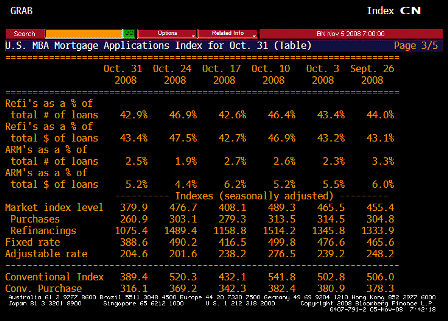
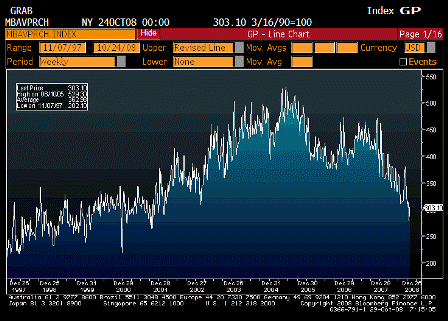
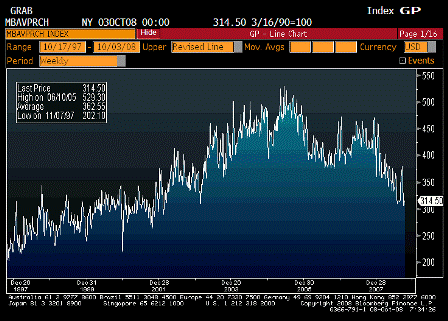
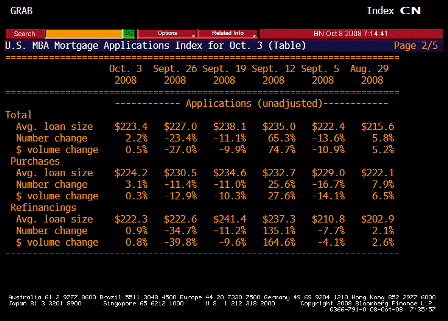
MBA Purchasing Applications (Nov 14)
| Survey |
n/a |
| Actual |
248.50 |
| Prior |
284.40 |
| Revised |
n/a |
Back down big time.
[top][end]
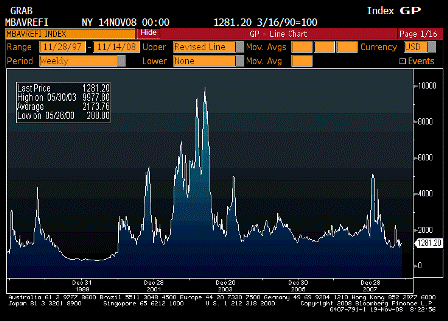


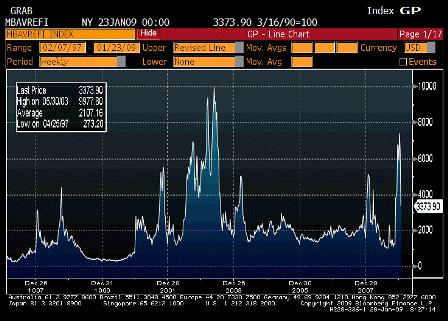
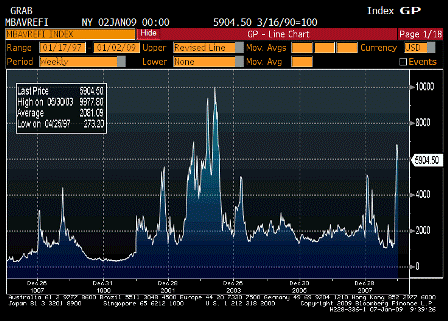
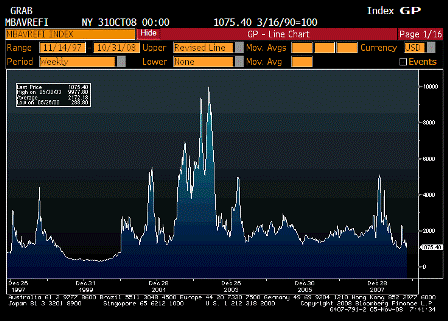
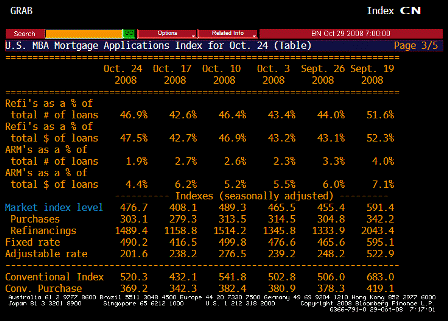
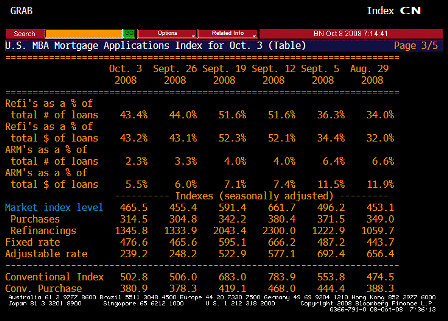
MBA Refinancing Applications (Nov 14)
| Survey |
n/a |
| Actual |
1281.20 |
| Prior |
1248.40 |
| Revised |
n/a |
[top][end]
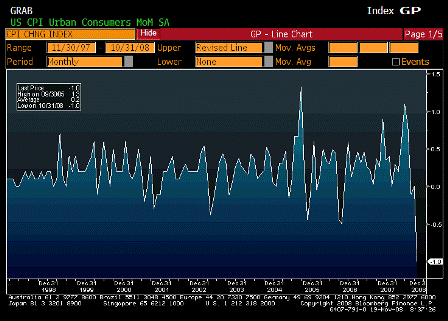


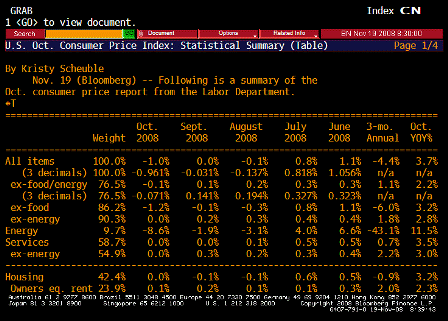
Consumer Price Index MoM (Oct)
| Survey |
-0.8% |
| Actual |
-1.0% |
| Prior |
0.0% |
| Revised |
n/a |
Not much of a surprise led by gasoline prices. More to come.
[top][end]
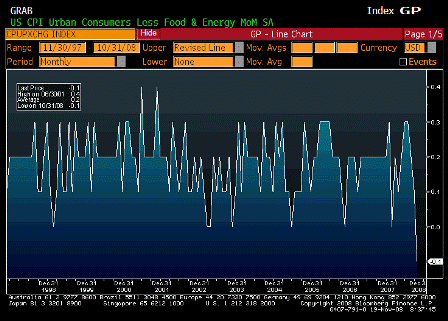


CPI Ex Food and Energy MoM (Oct)
| Survey |
0.1% |
| Actual |
-0.1% |
| Prior |
0.1% |
| Revised |
n/a |
Lower than expected. Owner equivalent remains positive at up 0.1%.
[top][end]
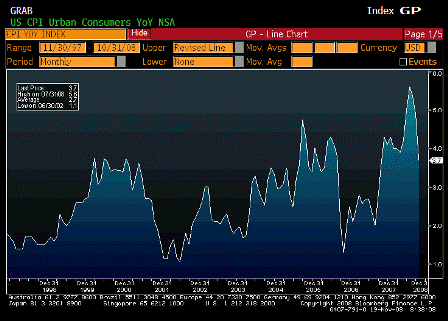


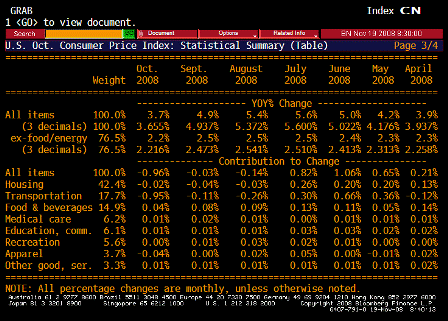
Consumer Price Index YoY (Oct)
| Survey |
4.0% |
| Actual |
3.7% |
| Prior |
4.9% |
| Revised |
n/a |
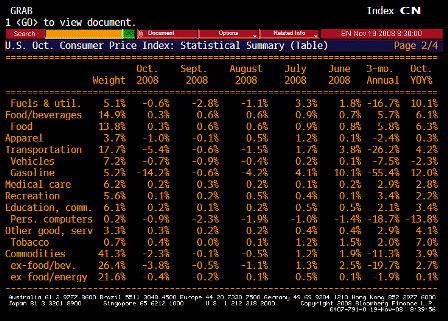
Coming down quickly with the fall in gasoline prices, much like Aug 06 when Goldman changed their commodity index and triggered a liquidation of gasoline inventories.
Karim writes:
- Largest single mthly fall on record in headline CPI: -0.961%
- Core also falls, by 0.071%
- Service inflation now unchanged for 2 straight months
- OER up 0.1%
- Apparel -1%, vehicles -0.7% (new -0.5%, used -2.4%)
- Medical care and education each up 0.2%
- Market strains + output gap + weaker commodities to lead to falling/slowing inflation in period ahead
[top][end]
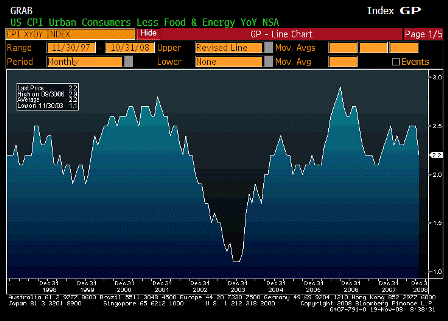


CPI Ex Food and Energy YoY (Oct)
| Survey |
2.4% |
| Actual |
2.2% |
| Prior |
2.5% |
| Revised |
n/a |
Also moving down.
[top][end]
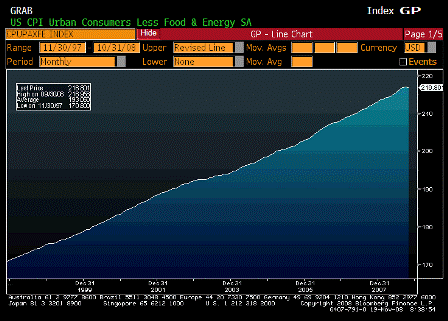


CPI Core Index SA (Oct)
| Survey |
n/a |
| Actual |
216.801 |
| Prior |
216.956 |
| Revised |
n/a |
[top][end]
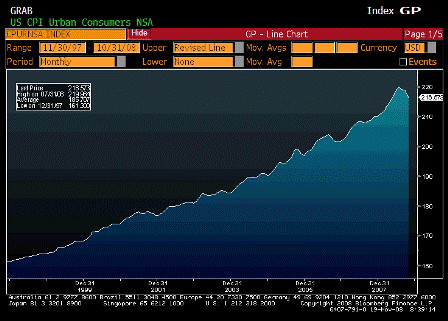


Consumer Price Index NSA (Oct)
| Survey |
216.700 |
| Actual |
216.573 |
| Prior |
218.783 |
| Revised |
n/a |
[top][end]


Consumer Price Index TABLE 1 (Oct)
[top][end]


Consumer Price Index TABLE 2 (Oct)
[top][end]


Consumer Price Index TABLE 3 (Oct)
[top][end]
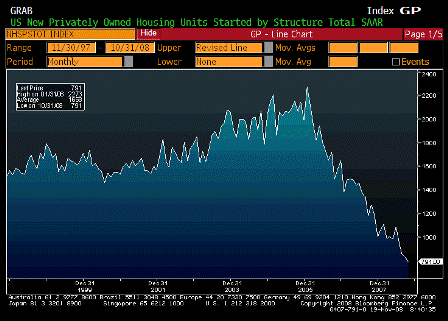


Housing Starts (Oct)
| Survey |
780K |
| Actual |
791K |
| Prior |
817K |
| Revised |
828K |
Looking grim again after showing signs of bottoming.
Karim writes:
- October housing starts down another 4.5% and permits down 12%-contribution from housing to GDP will remain a significant drag at least thru Q2 2009 (based on lag from permits to construction).
[top][end]
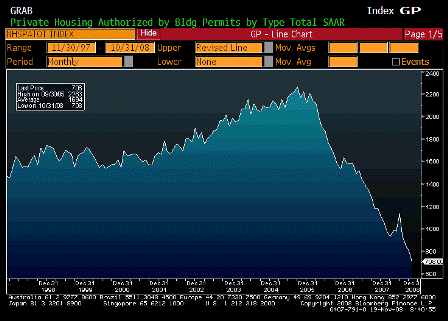


Building Permits (Oct)
| Survey |
774K |
| Actual |
708K |
| Prior |
786K |
| Revised |
805K |
[top]
