
Personal consumption expenditures: New autos
Category Archives: Uncategorized
Consumer credit
Stats from the high seas
fyi, this is only for containers:
Stats from the high seas: Stormy weather ahead
By Allen Wastler
slow start to holiday sales
And 2 fewer shopping days…
Holiday Sales Sag Despite Blitz of Deals
(WSJ) — Estimated total spending over Thanksgiving weekend fell to $57.4 billion, down 2.7% from a year ago, according to the National Retail Federation. It said it still expects total holiday sales through year-end to rise by 3.9% from a year ago. The retail trade group said the number of people who went shopping over the four-day weekend that kicked off with Thanksgiving rose slightly to 141 million, up from 139 million last year. Store traffic on Black Friday rose just 3.4% to 92 million shoppers. Preliminary results from ShopperTrak suggested that sales on Thursday and Friday combined rose 2.3% from a year earlier to $12.3 billion. The firm has forecast that this holiday-shopping season will be the worst since 2009, with retail sales in November and December rising by 2.4% from a year earlier, less than last year’s 3% increase and below gains of around 4% in 2011 and 2010.
Chicago pmi looking good, consumer confidence up
Go rust belt!
Maybe I’ll finally get a good price for the condos I bought in the early 80’s when I lived there…
Chicago PMI
Highlights
Monthly growth in composite activity in Chicago remains exceptionally strong, at 63.0 for this month’s reading vs an even stronger 65.9 in October. Strength is centered where it should be, in new orders which are at a robust 68.8. The prior reading, at 74.3, was a 9 year high. Production slowed in the month but remains very strong at 64.3 vs 71.1.
Employment is a special standout in today’s report, up 3.2 points to 60.9 which is the highest reading in more than 2 years. Inventories, at 61.1, show a sudden build as Chicago businesses prepare to fill orders. Backlog orders are growing strongly, deliveries are slowing, and price inputs are rising — all consistent with strong activity.
This report, which covers all areas of the Chicago economy, points to another month of solid growth for the coming ISM reports on manufacturing and non-manufacturing. The Dow is moving to opening highs following today’s report.
Consumer Sentiment
Market Consensus before announcement
The Reuter’s/University of Michigan’s consumer sentiment index slipped to 72.0 for the early November reading versus 73.2 for final October and versus 75.2 in the early October reading. The latest result was the 7th straight dip going through both early and final readings back to final July. The erosion continues to be centered in expectations which were at 62.3, down steadily from July’s peak at 76.5. Current conditions have also been coming down but less so, to 87.2 in the preliminary November reading versus a peak of 99.7 in early July.
household debt
Just noticed this. The question is whether it was proactive/desired and ongoing or one time/forced due to sequester and FICA hike income reductions.
“Household debt jumped US$127 billion in the third quarter, the biggest increase since the first quarter of 2008. The rise was across the board as Americans went into greater debt to buy everything from houses to cars to schooling. Household debt is now growing faster than both gross domestic product and disposable income, returning to the pattern that drove both economic growth and serial bubbles in the past decade.”
(Thanks Edward Harrison)
John Carney: What I Read
Thanks JC!
John Carney: What I Read
I’ll open my email to see what my colleagues at CNBC have been emailing me about, what sources have been emailing me. I’ll read through what I consider the big macro economics blogs, like Pragmatic Capitalism, or Mosler Economics, The Money Illusion, and occasionally Paul Krugman, to see what they’re talking about.
philadelpha fed breakdown
I know, prices paid are up which is the most reliable indicator of a strong economy…
And higher inventory is the best indicator of future sales and deliveries…
And it’s better than the May numbers…
;)
More seriously, the attached graph doesn’t look as bad as the breakdown.
Full size image
Full size image
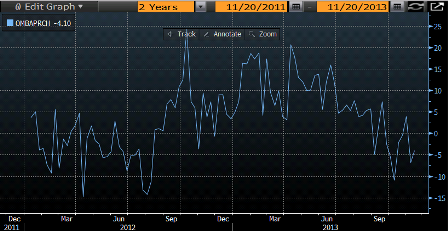
purch apps y/y
Corporate Results Expose Lack of Confidence
Corporate Results Expose Lack of Confidence
November 18 (WSJ) — Though corporate profits were higher overall, companies slashed their spending on factories, equipment and other performance-enhancing investments by 16% from year-earlier levels, according to an analysis by REL Consultancy for The Wall Street Journal. Almost 90% of the companies that have given financial forecasts for the final quarter of the year have prompted Wall Street analysts to lower their numbers. Only a dozen companies have painted rosier pictures, according to data tracker FactSet. With more than 90% of companies in the S&P 500 index having posted results for the quarter, blended earnings were up 3.5% from a year earlier, and profit remained in record territory, according to FactSet. Profit margins, at 9.6%, were near records, thanks to cost cutting, automation and lower commodity prices. But revenue growth was a tepid 2.9% from a year earlier.