This just came out.
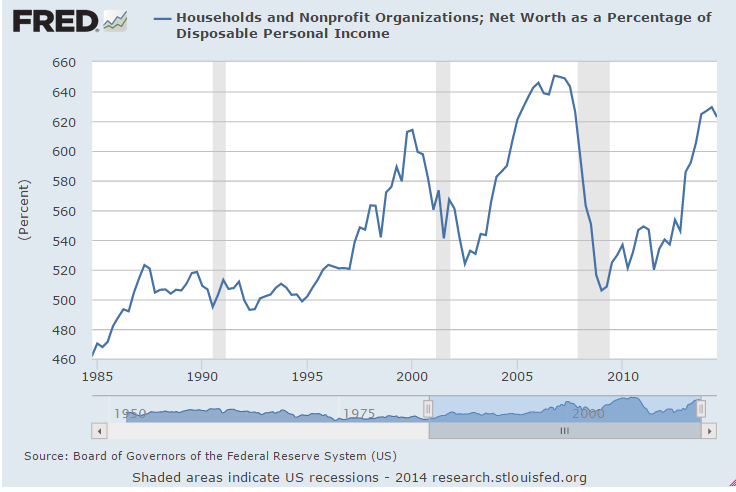
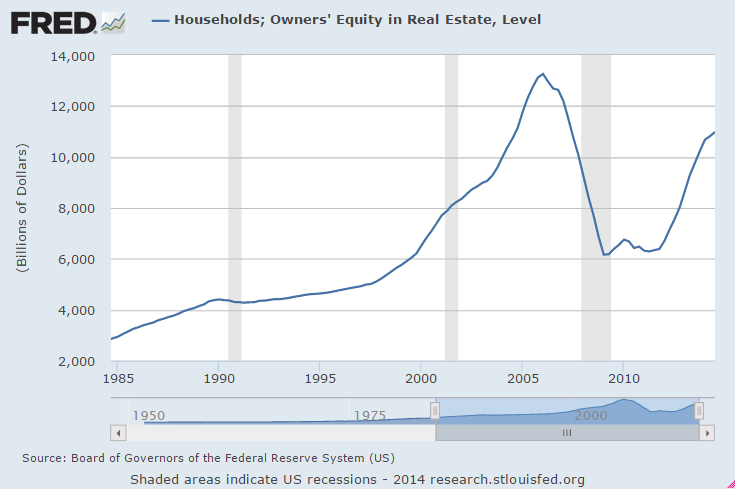
Net worth is largely a function of prices of stocks and houses:

Seems no one knows quite what it is…
;)
Labor Market Conditions Index
Highlights
The Fed’s Labor Market Conditions Index showed softening labor market conditions in November. The index pulls together 19 different labor market indicators. The November index posted at 2.9 versus a revised 3.9 for October. The November number is the lowest since January 2014 and suggests that the Fed will maintain loose monetary policy into 2015. The Fed only occasionally publishes details of the index since it is not an official indicator release but instead a research department number.
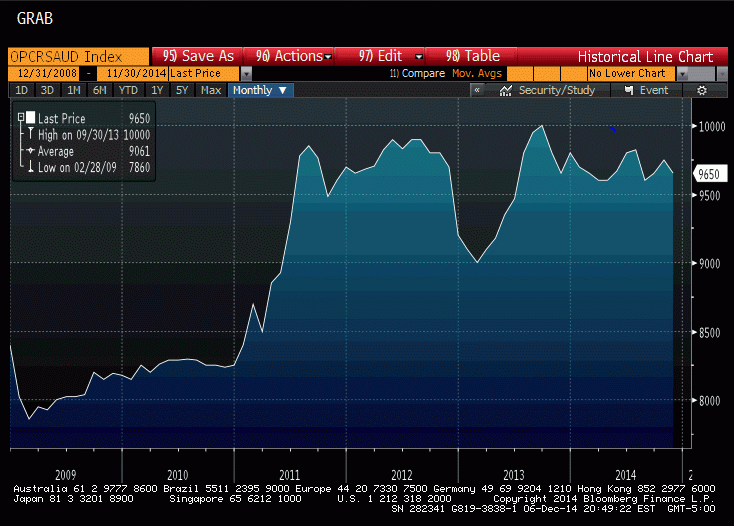
Saudis post prices for refiners, then let them buy all they want at those prices. The chart shows the ‘residual demand’ for crude oil has been reasonably steady, indicating that the price did not move due to any kind of a ‘supply glut’ but to Saudi pricing:
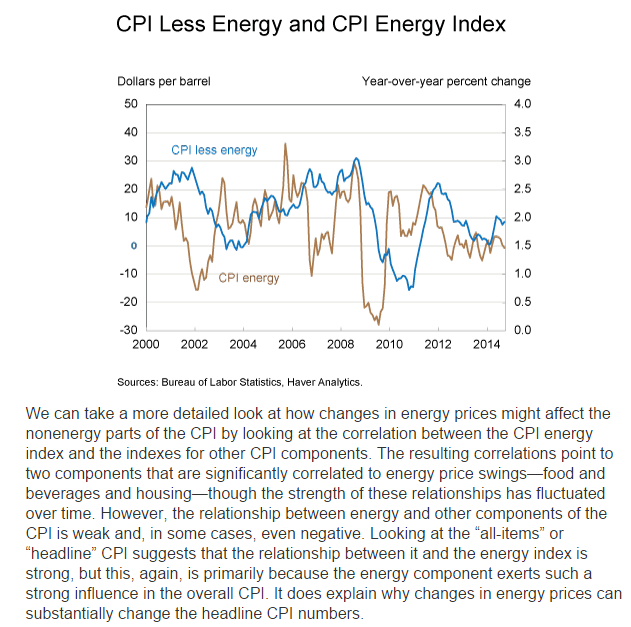
To my point about crude price cuts triggering a general deflation, this is from the Cleveland Fed. Note that in 2008 the price of crude went to 35 but only briefly. My concern is that if crude were to stay low the deflationary effect would continue perhaps until prior relative value was restored:
Since the CPI is most directly influenced by oil price changes through its energy component, one question that remains is whether or not other components in the CPI are influenced by low oil prices. Generally, energy prices are rather volatile, and so energy components are often excluded when predicting inflation because of that volatility. Forecasters focus on “core” measures instead. The recent decline in oil prices is of less concern to many CPI forecasters, because it may not affect the “core” price level. It would be a bit more concerning, however, if low oil prices also affected other domestic prices as well. A quick look at the year-over-year percent changes in the energy CPI and the CPI excluding energy suggests changes in energy prices are often followed by similar changes in the rest of the CPI’s components.
November budget review-up slightly year over year for November
From the Congressional Budget Office:
The federal government’s budget deficit was $181 billion for the first two months of fiscal year 2015, $45 billion less than the shortfall recorded in October and November of last year, CBO estimates. That outcome was affected by shifts in the timing of certain payments. Without those shifts, the deficit would have declined by just $9 billion.
Estimated Deficit in November 2014: $59 Billion
CBO estimates that the government recorded a deficit of $59 billion in November 2014—$76 billion less than the deficit in November 2013. But shifts in the timing of certain payments (because the regular payment dates fell on weekends) boosted spending in November 2013 and reduced it in November 2014. Without those shifts, the November 2014 deficit would have been $3 billion more than the November 2013 deficit.
Individual income taxes and payroll taxes together increased by $5 billion (or 2 percent); a $4 billion increase in withheld taxes explains nearly all of that change.
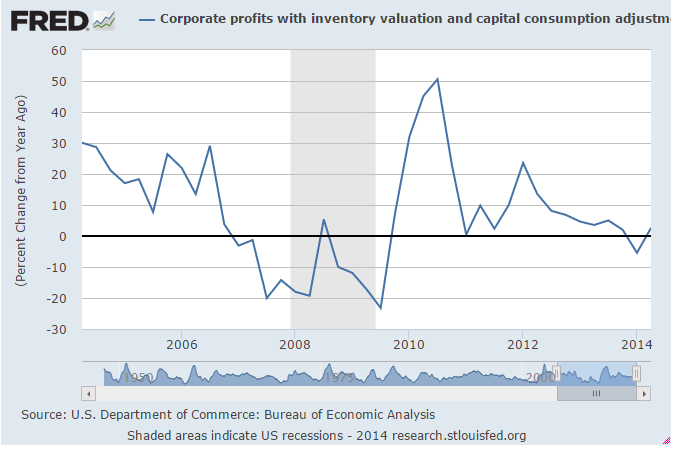
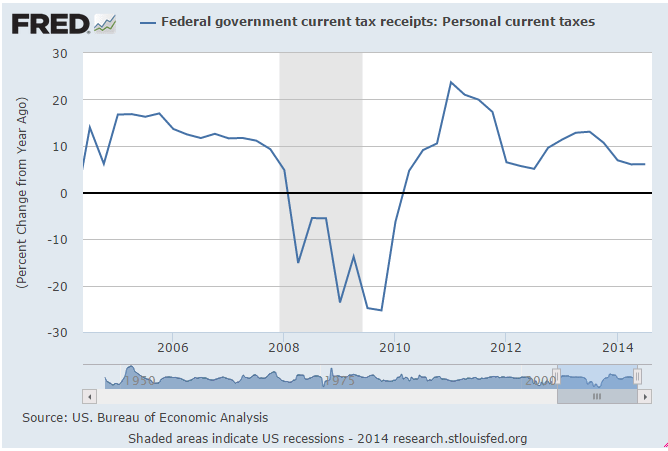
This is quarterly data released a couple of weeks ago. You can see the growth had slowed to 6.1%, and now most recently is down to 2%, which is a red flag for negative GDP growth:
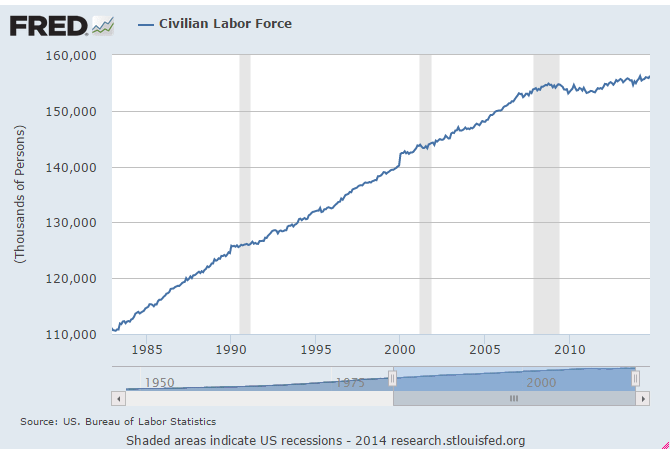
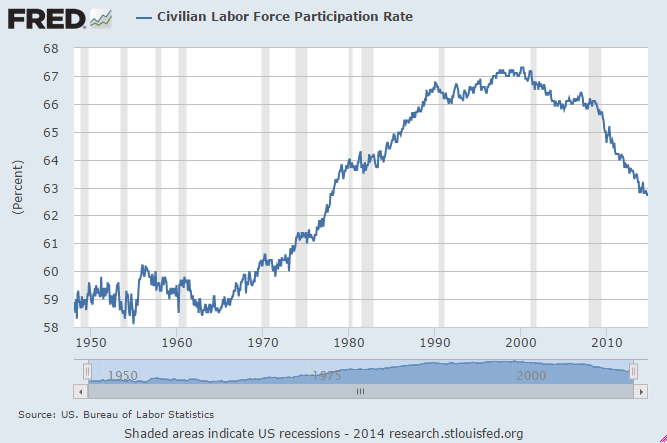
Note the labor force grew continuously then hit a brick wall with the collapse in aggregate demand in 2008 and has yet to resume it’s prior rate of growth. This has all been attributed to ‘demographics’ by the mainstream:
This is the same chart but just for the last year. Note the drop off at the end of 2013 as cold weather hit and subsequent increase through the peak in April when the new jobs report peaked as well.
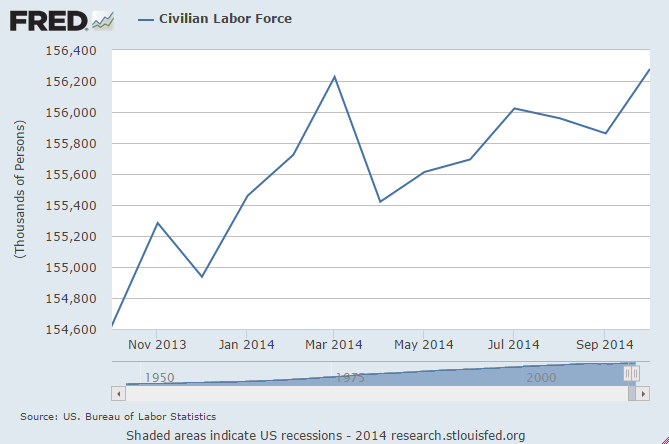
So what’s happened is that most new hires came from ‘new entries’ into the labor force rather than the ‘unemployed’ and unemployment has gone down largely as a function of the growing labor force. The participation rate tells the same story:
New jobs peaked in April and have been working their way lower. We’ll see Friday if that continues.
Because the ECRI forecast a recession a few years ago during a spate of weakness it’s being ignored this time. The difference is, as previously discussed, last time the deficit was running around 9% of GDP, while this time it’s at a recession friendly sub 3% of GDP:
21 November 2014: ECRI’s WLI Improves Marginally But Remains in Contraction
ECRI’s WLI Growth Index improved marginally but has been in negative territory for 6 weeks. This index is forecasting a slight business cycle contraction in 1Q2015. Obviously the markets do not share ECRI’s view the business cycle is taking a downturn.
Euclid asserts that its metrics illustrate a cautious outlook for industry revenues, and estimates sales growth in the following retail verticals of:
- 5.7% decline year-over-year in general merchandise, apparel, furniture and other (GAFO) retail sales
- 0.9% growth year-over-year in clothing and apparel sales
- 2.7% decline year-over-year in general merchandise sales
Also interesting: For the first time since 2008, the public sector will add jobs in 2014. State and local governments started adding a few jobs last year, but austerity has been ongoing at the Federal level. According to the WSJ The Federal Government Now Employs the Fewest People Since 1966
Not since July 1966 has the federal government’s workforce been so small. … But that’s only the raw numbers! As a share of the total workforce … data going back to 1939 would show no point where the federal government’s share of employment was so low.
In the last 75 years (when the BLS started tracking the data), the public sector (non-military) shed jobs in 12 years. Three of those years were at the end of WWII, two in the early ’80s, and the last five consecutive years (unprecedented streak since the Great Depression).
Again, this all happens when the deficit gets too small to ‘offset’ the unspent income in the economy:
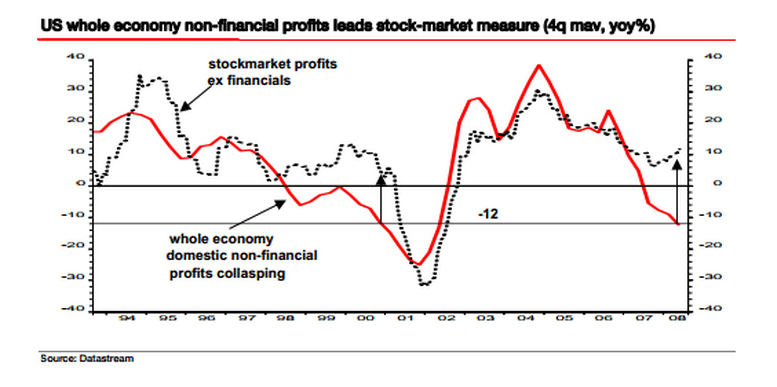
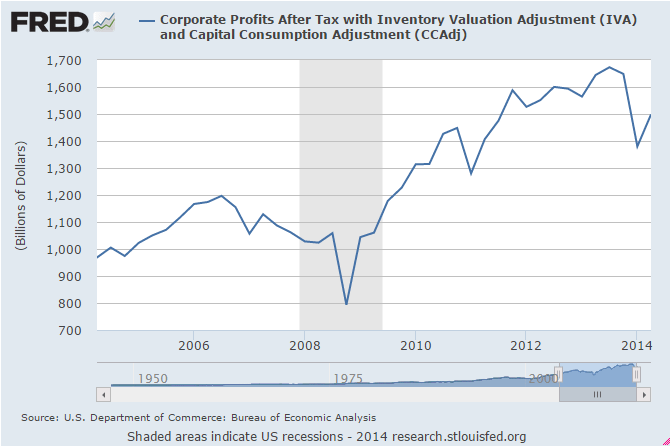
Update on non-financial profits: