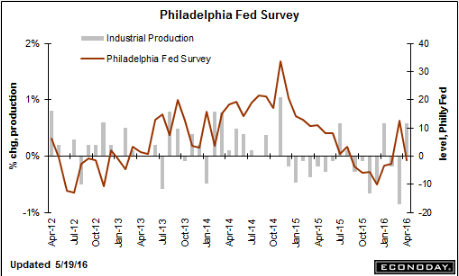
Redbook retail sales, Richmond Fed, New home sales, Chemical activity barometer

From bad to worse:
er-5-25-1
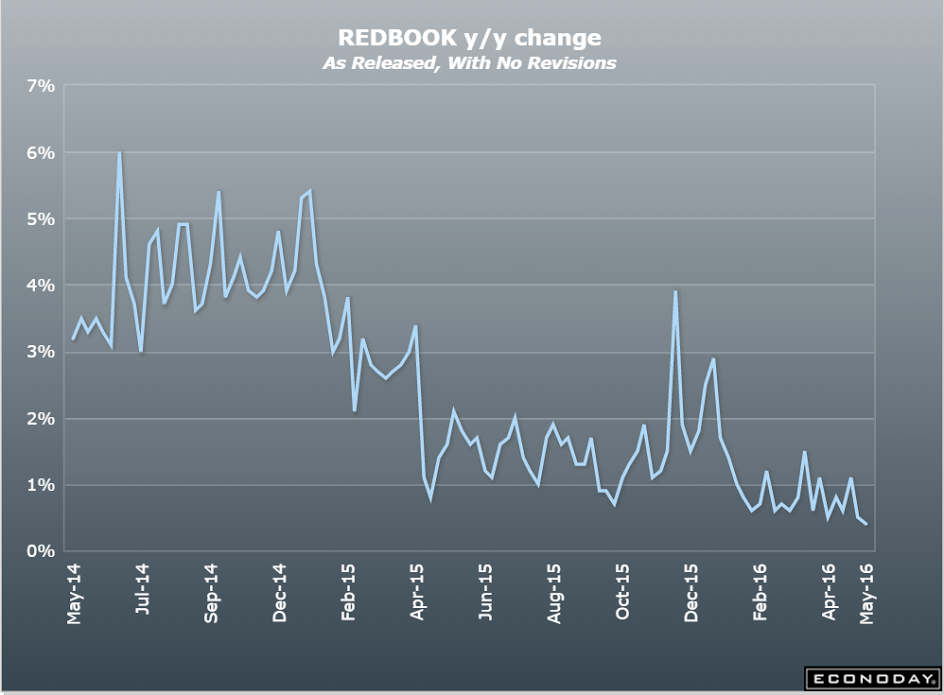
Another May reversal from a hopeful April gain:

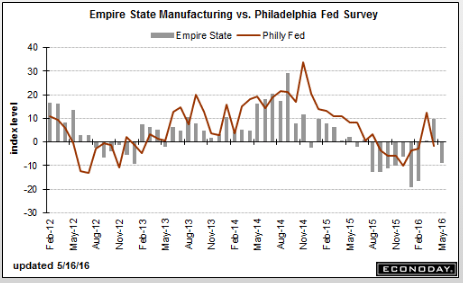
Richmond Fed Manufacturing Index
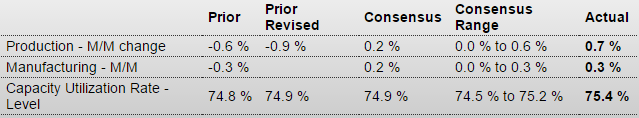
er-5-25-2
Highlights
The Richmond Fed index fell a sharp 15 points in May to minus 1, adding further evidence of a serious slowdown in manufacturing activity as also indicated in last week’s Empire State and Philly Fed reports for May. Several of the survey’s key measures dropped steeply and went into contraction from previous strength, with shipments down 22 points from April to -8, backlog orders down 24 points to -13 and capacity utilization down 24 points to -6. New orders which were particularly strong in the previous two months, dropped 18 points to 0. On the employment side, wages remained at a respectable plus 15, but the average workweek fell 4 points to 6 and the number of employees index shed 4 points to 4. Only inventories and prices were a positive for manufacturing in the Richmond Fed region during May, with finished inventories up 5 points to 19 and raw materials inventories up 10 points to 25, while prices received finally showed a small improvement, rising to an annualized rate of 0.77 percent.

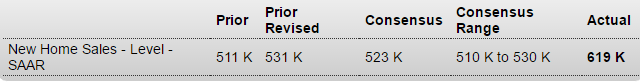
Unexpectedly large April jump in this volatile series. Best to wait and see what May brings before jumping to conclusions?
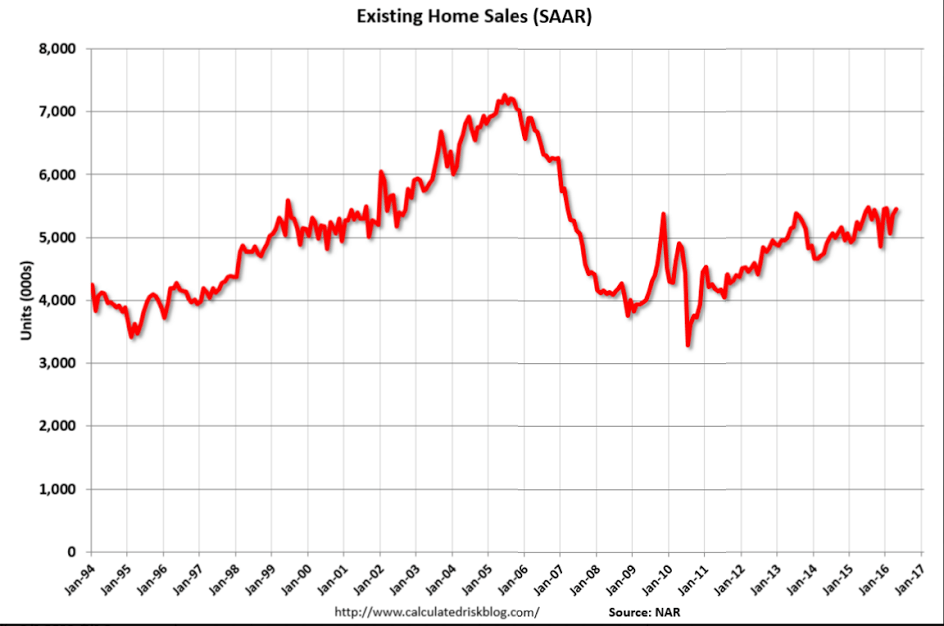
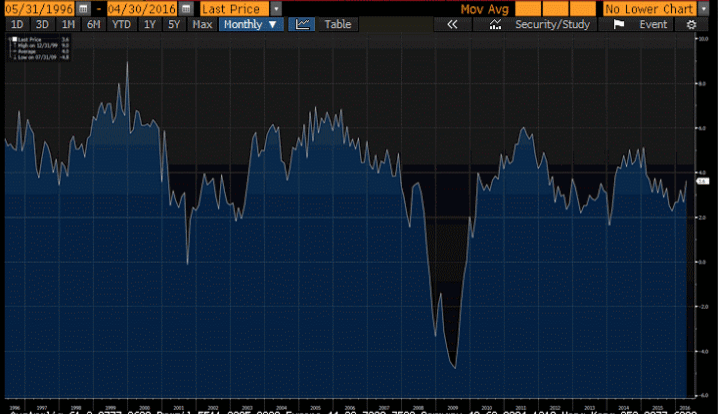
New Home Sales
er-5-25-3
Highlights
The new home sales report has sealed its reputation as the wildest set of data around. April’s annualized rate came in at 619,000 which is not a misprint. This is the highest rate since January 2008 and dwarfs all readings of the recovery. February 2015’s rate, way behind at 545,000, is the next highest rate this cycle. The data even include a very large 39,000 net upward revision to the two prior months, a gain that reflects annual revisions which are included in the data. The monthly 16.6 percent surge is not only far beyond expectations but is the biggest monthly gain since way back in January 1992.

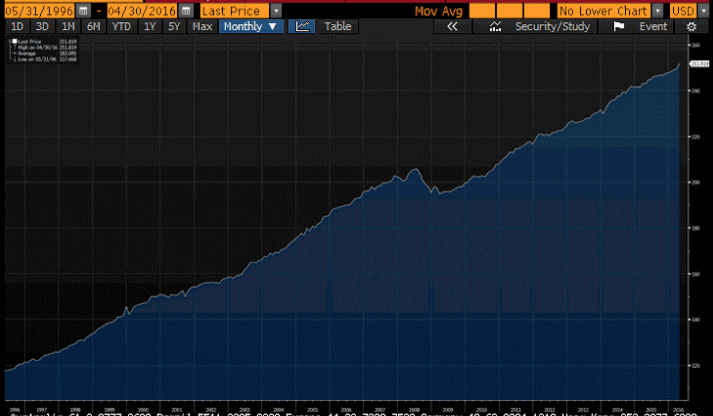
The data also include a big jump in prices, up 7.8 percent in the month to a record median $321,100 while the year-on-year rate, which was negative in the March report, is at plus 9.7 percent year-on-year.

But the surge in sales is a negative for supply as supply relative to sales fell very sharply to 4.7 months from 5.5 months. The total number of new homes for sale was little changed, down 1,000 at 243,000.

Regional data show a more than 50 percent jump in the Northeast where however the number of sales relative to other regions is very low. The same is true of the Midwest where sales fell 4.8 percent in the month. The two main regions for new home sales both show outsized gains with the South up 15.8 percent and the West up 23.6 percent.

Year-on-year, total sales are suddenly up 23.8 percent, this at the same time that the median price is now well past the 6 percent rate where housing appreciation had been trending. Even though new home sales are volatile, which reflects the report’s small sample sizes, and even though low supply will limit future gains, the outlook for housing just got a big boost. Talk will build for a greater contribution from housing to overall growth. Watch for FHFA house price data on tomorrow’s calendar where another month of solid appreciation is expected.

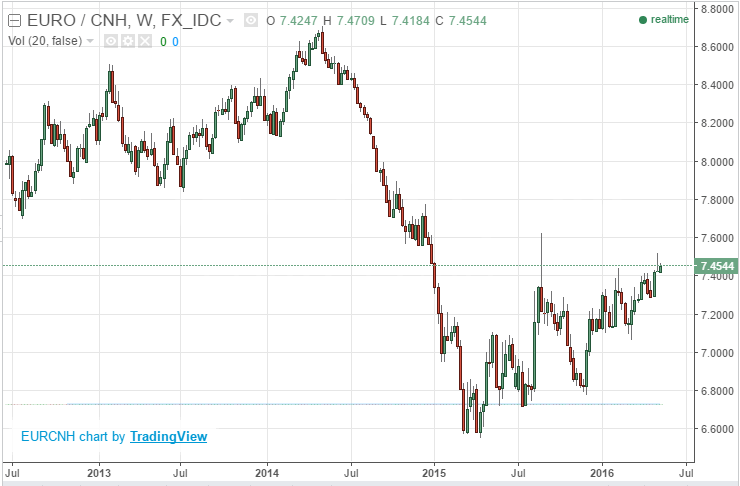
Nice move higher but still at very low levels:
er-5-25-4

Japan trade, Rail week, Medicare payments

Imports and exports down, as global trade continues to wind down. And the trade surplus remains yen friendly. However intervention will likely prevent any material yen appreciation:

er-5-22-16-1

Rail Again Moves Deeper Into Contraction

Week 19 of 2016 shows same week total rail traffic (from same week one year ago) declined according to the Association of American Railroads (AAR) traffic data. Rolling averages continue moving deeper into contraction.

The deceleration in the rail rolling averages began one year ago, and now rail movements are being compared against weaker 2015 data – and it continues to decline. We do not believe the data is affected this week by the labor issues in the ports one year ago.

Medicare Payment Cuts Continue To Restrain Inflation

from the San Francisco Fed

A steady downward trend in health-care services price inflation over the past decade has been a major factor holding down core inflation. Much of this downward trend reflects lower payments from public insurance programs. Looking ahead, current legislative guidelines imply considerable restraint on future public insurance payment growth. Therefore, overall health-care services price inflation is unlikely to rebound and appears likely to continue to be a drag on inflation.

Existing home sales, EU current account surplus, Tech IPO’s

A bit higher than expected now been going sideways for almost a year:

Existing Home Sales
er-5-20-1

er-5-20-2
er-5-20-3
Euro Area current account surplus continues to zig zag it’s way higher:

Euro Area Current Account

Eurozone current account surplus came in at €32.3 billion in March of 2016 compared to an upwardly revised €11.2 billion surplus in the previous month. The surpluses in balances of goods (to €36.1 billion from €25.2 billion in February) and services (to €4.5 billion from €3.2 billion) widened while the one in primary income (to €6.5 billion from €6.8 billion) narrowed slightly. In addition, the secondary income deficit decreased (to €-14.8 billion from €-24 billion).
er-5-20-4

This is ‘borrowing to spend’ that’s gone away:
er-5-20-5

Philly Fed, Chicago Fed

Back into contraction after a blip up in April:

Philadelphia Fed Business Outlook Survey
er-5-19-16-1
Highlights
After popping higher in March the Philly Fed index has been dead flat since, at minus 1.6 in April and now minus 1.8 for May to point to slight contraction in the Mid-Atlantic manufacturing sector.

After jumping to 15.7 in March, new orders posted a zero in April followed now by minus 1.9 in May. And contraction in unfilled orders is deepening, at minus 8.8 vs minus 6.3 and minus 1.9 in the prior two months. Employment remains in contraction at minus 3.3 with the workweek also in contraction and at a steep minus 15.1.

Shipments are down as are inventories while confidence in the 6-month outlook is eroding, though only moderately. And price data are positive and are showing some welcome pressure, at 15.7 for inputs for a second month of solid improvement and at 14.8 for selling prices which is the best reading since October 2014.

But the bulk of this report is a disappointment and follows even greater weakness in Monday’s Empire State report. The factory sector continues to stumble along, not yet showing much benefit from the falling dollar, which boosts exports, nor the rebound in oil prices which should eventually boost energy spending.

er-5-19-16-2
Up this month but it’s volatile month to month so best to look at the 3 month average which went more negative:
er-5-19-16-3
er-5-19-16-4

CPI, Housing starts, Redbook retail sales, E commerce retail sales, Industrial production, NY Fed and Atlanta Fed forecasts

Still below the Fed’s target and ‘core’ moving down a bit year over year:

Consumer Price Index
er-5-17-1

er-5-17-2
Housing starts better than expected, permits up a bit and last month’s revised down a bit.

And, of course, no house legally gets built without a prior permit and the chart isn’t looking promising:

Housing Starts
er-5-17-3

er-5-17-4
Still down and out:
er-5-17-5
And E commerce retail sales growth is working its way lower as well:
er-5-17-6
Note the % change this year vs last year chart, which takes out all the ‘seasonal’ factors, remains negative:

Industrial Production
er-5-17-7

er-5-17-8
The two Feds are somewhat divergent. And I still don’t see the credit expansion required to offset savings desires:
er-5-17-10
er-5-17-9

Empire Survey, Home builder index, Abe on G7

Not good. Raises the specter of May having weakened after some April numbers were looking a bit better:

Empire State Mfg Survey
er-5-16-4
Highlights
What little momentum there was in the New York manufacturing sector is fizzling, based on the Empire State index which came in much weaker-than-expected, at minus 9.02 in the May report to end two lonely looking gains in April and March.

New orders are at minus 5.54, also ending two prior months of gains and rejoining a long run of negative readings going back all last year. Inventories, at minus 7.29, are extending their equally long dismal run of contraction as manufacturers, seeing soft demand ahead, work down their stocks. Employment, at plus 2.08, is up for a second month but just barely while shipments turned lower, to minus 1.94. Selling prices are down, the workweek is down, and delivery times are shortening — all signs of weakness.

This together with the Philly Fed, which are the two most closely watched regional reports, have been showing bursts of life the last few months, in what perhaps are early indications of strength tied to dollar depreciation and lower oil prices. But this report is definitely not among this group and will raise talk of another flat year for manufacturing. The Philly Fed, to be posted Thursday, looks to be a major highlight of the week.

er-5-16-5
Lower than expected and still seems like the depressed housing industry has most recently been decelerating, as per the chart:

Housing Market Index
er-5-16-6
Highlights
Optimism among home builders is solid and steady, at 58 for the May housing market index. This is the fourth straight 58 for this index where anything over 50 is positive. And sales are the most positive component in this report, at 65 for 6-month sales and 63 for present sales. The drag on the index comes from traffic, unchanged at 44 and continuing to reflect unusual lack of interest from first-time buyers.

The West has the highest composite score at 67, befitting the region’s importance for new construction. The South, which is the largest market, is next at 60 with the Midwest right behind at 59. The Northeast, where dense development limits the new home market, trails in the far distance at 36.

The availability of jobs together with low mortgage rates are solid pluses for the new housing outlook. But strength in the housing sector has been less than overwhelming this year and lack of acceleration in this report is part of the story.

er-5-16-7
Finally!

Japanese Prime Minister Shinzo Abe said on Monday a majority of Group of Seven leaders agree on the need to deploy fiscal stimulus measures to boost global demand.

Japan will host a G7 finance ministers and central bankers summit on May 20-21, and there are doubts about how much progress policymakers can make in shifting the global economy out of its current spell of slow growth and low inflation.

Earlier this month, Abe traveled to Europe to meet G7 heads in preparation for the meeting in Japan.

Tax receipts, Retail sales control group, Consumer sentiment

Weak U.S. tax receipts suggest things are not so good for the U.S. consumer even as employment continues to grow, Deutsche Bank Chief U.S. Economist Joseph LaVorgna said Monday.The three-month moving average for U.S. jobs gains remains “good” at around 200,000 positions per month, but growth in tax receipts has fallen from about 6 percent a year ago to 3 percent today, LaVorgna said.”That tells me income growth is a lot weaker than what official numbers show, which would explain why consumer spending has been so soft,” he told CNBC’s “Squawk Box.”

The so called ‘control group’ is retail sales minus food, auto dealers, building materials, and gas stations and used as an indication of ‘core’ consumer spending.

Note that it was growing faster before 2008, when it collapsed. And while it again has grown since 2008, the annual rate of growth has been working its way lower over time:
er-5-16-1
er-5-16-2

First, this survey is ‘one man one vote’ and not ‘one dollar one vote’. So when the price of gasoline collapsed even thought it was a transfer of funds, to the penny, from sellers to buyers, there were nominally many more buyers than sellers, so this survey spiked up. And the weak retail sales since the oil related capital expenditures collapsed support this narrative.

Second, even so sentiment is not all that high vs prior cycles.
er-5-16-3

Retail sales, Consumer sentiment, Euro lending, Rail week

Better than expected and some upward revisions as well.

Retail Sales
me-5-13-1
Highlights
The consumer snapped back to life in April, driving retail sales 1.3 percent higher to beat Econoday’s consensus by 4 tenths and the high estimate by 1 tenth. Gains are spread throughout most of the report.

Autos are the key component, up a sharp 3.2 percent to reverse the prior month’s decline. Excluding autos, retail sales rose 0.8 percent.

Sales at gasoline stations, boosted by higher prices, also contributed strongly, up 2.2 percent in the month. But even excluding both autos and gasoline, sales still rose 0.6 percent for the third straight gain, two of which are very strong.

Apparel was a big contributor in April along with nonstore retailers and with restaurants also showing a gain. The only component in contraction was building materials & garden equipment which hints at a little cooling for what has been very solid residential investment.

Year-on-year rates all improved though total sales remain very soft at 3.0 percent. Auto sales, pulled down by tough comparisons with very strong sales this time last year, are up only 3.1 percent on the year. But other components show strength with the ex-auto ex-gas rate at a healthy 4.4 percent for a 5 tenths gain in the month.

Today’s report points to a solid start for the second quarter and gives some life to the possibility of a June FOMC rate hike.

Notice how this has flattened (decelerated):
me-5-13-2
me-5-13-3
Welcome move back up here:
me-5-13-4
Note how in the euro area it was a sudden shortfall in private sector deficit spending that reduced aggregate demand, and has yet to recover or be ‘replaced’ by either lower taxes or more public spending:
me-5-13-5

Rail Week Ending 07 May 2016: Rail Continues To Move Deeper Into Contraction

Week 18 of 2016 shows same week total rail traffic (from same week one year ago) declined according to the Association of American Railroads (AAR) traffic data. Rolling averages continue moving deeper into contraction.

Non performing loans, Working poor, China export policy, STX-STT ferry

Check out the second chart:

2016 Q1 call report data is available at BankRegData.com. Industry wide assets leapt to $16.293 Trillion adding an amazing $325.59 Billion (2.04%) in the 1st Quarter.
er-5-12-16-1
The $325.59 Billion increase is the largest since (you guessed it) the $337.96 Billion jump in 2008 Q1 – a span of 32 quarters.

er-5-12-16-2
What’s even more amazing is that the 1.24% would really be 1.28% if C&I lending had stayed flat. The jump to 1.24% was actually lower than it should have been due to the additional $71.168 Billion in additional C&I lending over last quarter.

I would caution that we’re beyond the “it’s Energy related” part of the commentary. C&I delinquencies are rising in most geographies and at most big banks.

The following table lists the Top 15 C&I lenders top to bottom. At the top is Bank of America with $239.58 Billion in C&I (at an average Yield of 2.97%) and Bank of Montreal is #15 with $24.88 Billion in C&I.

C&I NPL % Heat Map Top 15 C&I Lenders
er-5-12-16-3
Wells Fargo has seen it’s C&I NPL % climb from 0.55% in 2015 Q2 to 1.52% in 2016 Q1 – NPL $ climbed $1.46 Billion in the quarter.

Take a gander at Capital One jumping from 2.24% to 3.98%. Even SunTrust which had been performing exceptionally well has seen rates go from 0.20% 3 quarters ago to 1.09% – a fivefold jump in the rate in 6 months.

The two standouts in the group are Toronto-Dominion and Bank of Montreal. Both banks have seen NPL % rates decline over the past year. I’m sure it’s just a coincidence that both are BankRegData clients. Yes, shameless plug and one I hope they’ll forgive me for.

Levity aside, C&I NPLs are getting worse and are likely to climb considerably higher in the next few quarters. We can’t add near $750 Billion in new lending in 6 years and not expect higher subsequent NPLs.

One in three US manufacturing workers are on welfare: Study

Philadonna Wade’s story plays out across middle America on a daily basis but is seldom told. It’s the story of the working poor who labor in tough jobs — like Wade’s position as an assembler for a Ford Motor plant — that don’t pay enough to keep them off public assistance.

In fact, fully 1 in 3 Americans who work in the manufacturing sector are receiving some form of public assistance, according to a study released this week by the UC Berkeley Center for Labor Research and Education. Of those who came to their positions through temp agencies, a category in which Wade falls, half are on some type of safety net program.

It’s not that Wade wants to be on food stamps and Medicaid, among other programs, it’s that the mother of four has no choice.

China continues to push exports, including what appears to me to be (re)targeting the euro area by buying euro a year or so after Draghi freightened them into lightening up on their euro reserves:

China Introduces Proposals to Boost Exports

May 9 (WSJ) — In policy guidelines released Monday, the State Council, the government’s cabinet, called for greater lending by banks to support small-scale and profitable exporters and said it would expand rebates of value-added taxes. It also promised to reduce short-term rates for export credit insurance, which protects exporters against nonpayment by foreign customers. “Presently, the foreign trade situation is complicated and severe, elements of uncertainty and instability are increasing and downstream pressures are continuously growing,” the State Council said.
er-5-12-16-4

Ferryboat Touches Water for First Time; Launch Trip Projected for Mid-June

China, Fed’s labor market index

More evidence global demand is slowing as both exports and imports fell. In any case the trade surplus continues, providing fundamental currency strength which probably translates into continuing fx reserve builds:

China’s exports drop again in April; imports also plunge
er-5-9-1
Highlights
Employment has been the economy’s central strength but has not been in the positive column for the labor market conditions index which remains in contraction for a 4th straight month, at minus 0.9 in April. Still, this is an improvement from March’s minus 2.1, a month when payroll growth and the participation rate were stronger but not other data that are tracked in this composite including the 12-month reading for average hourly earnings or the jobs-hard-to-get subcomponent of the consumer confidence report which both showed strength in April. The index, experimental in nature, is a broad composite of 19 separate indicators and, as yet at least, is rarely cited by policy makers.