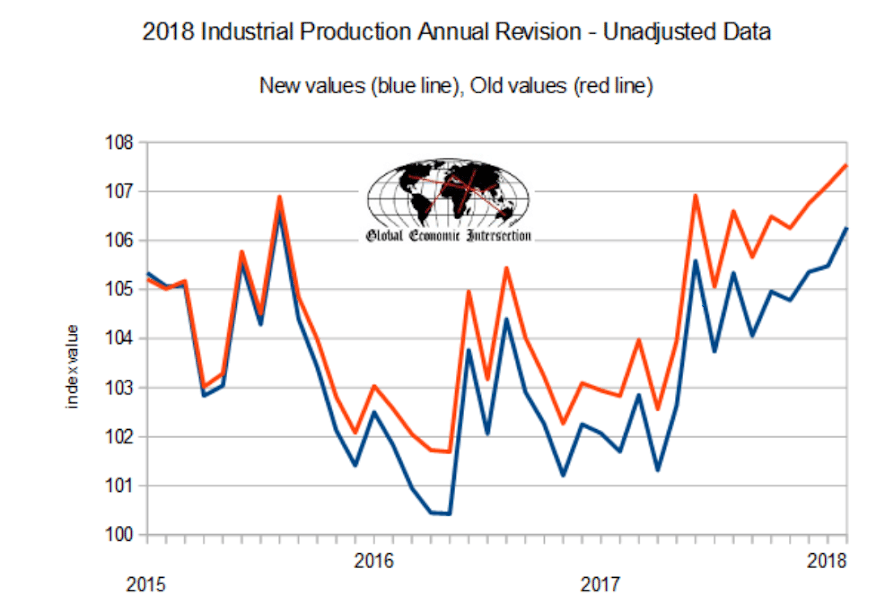
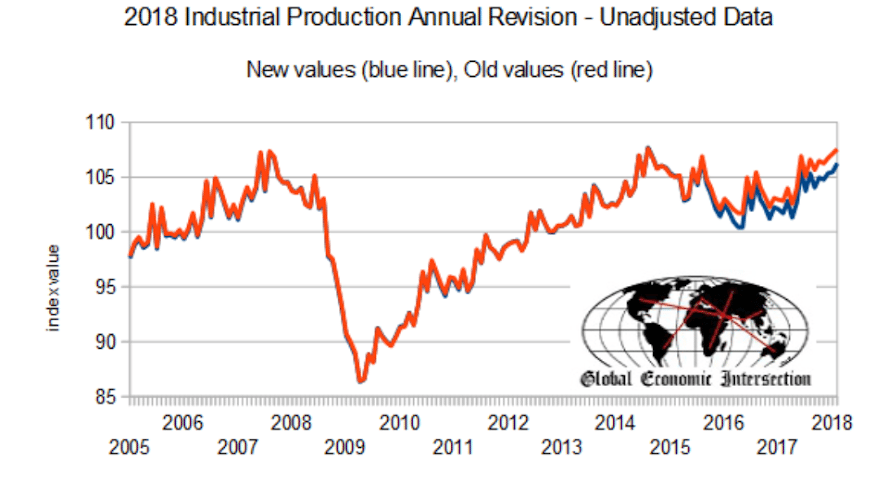
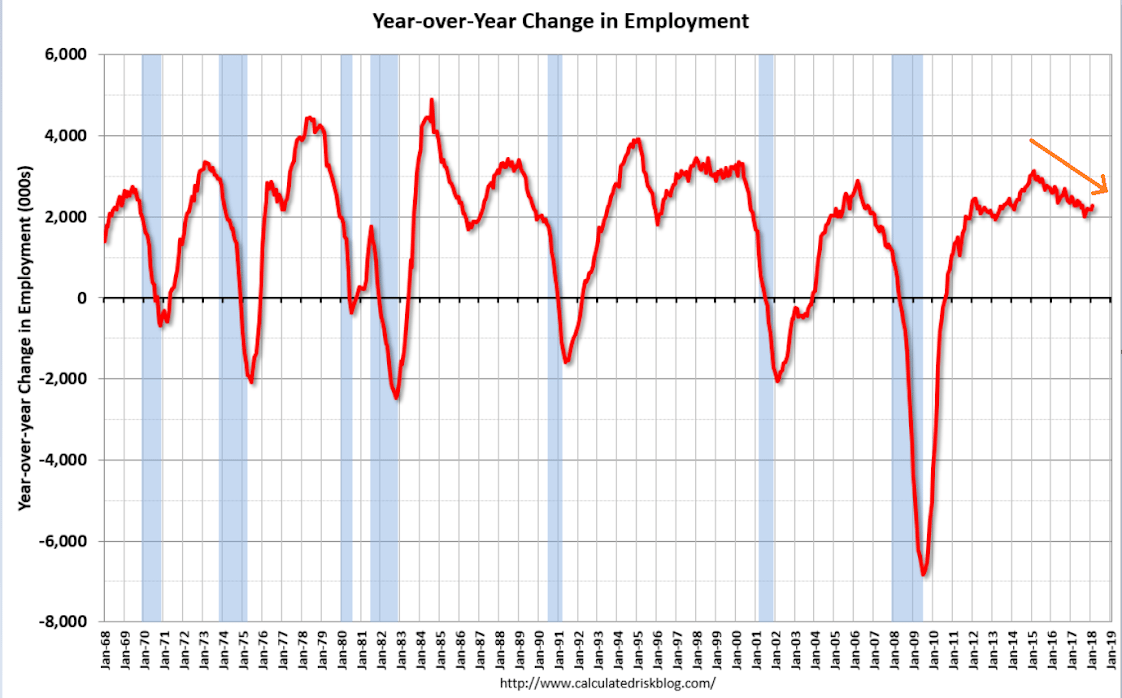
Big downward revision. This is somewhat like how we’ve gotten ‘revised into recession’ in past cycles:
RESULTS OF THE REVISION
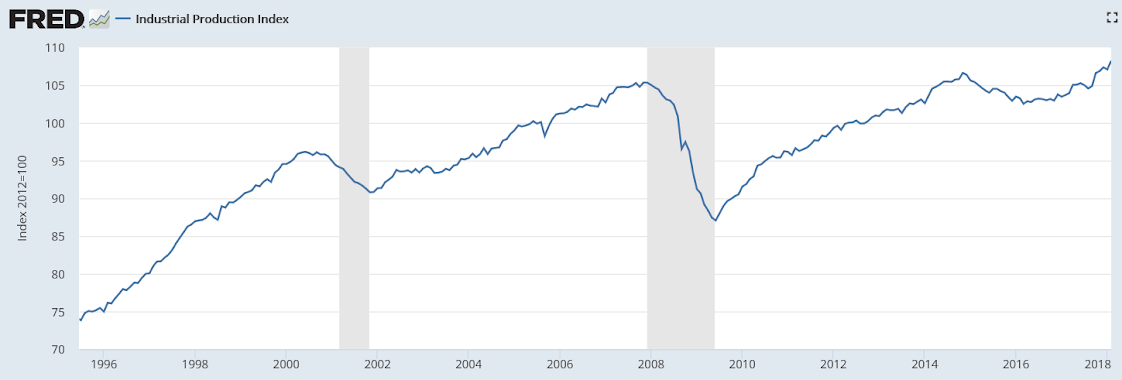
Industrial Production
Manufacturing output is now estimated to have declined about 1 1/2 percent in 2015, to have been little changed in 2016, and then to have advanced about 2 percent in 2017. These rates of change are lower than their previously reported values, especially for 2015, which was revised down 1.0 percentage point. The cumulative effect of these revisions leaves manufacturing IP in February 2018 about 5 1/2 percent below its pre-recession peak.
The rates of change for mining have been revised up for 2014 and 2015 and revised down for 2016 and 2017. The contour for mining output shows an especially large gain in 2014 followed by sizable drops in 2015 and 2016; output increased strongly in 2017. The rates of change for utilities output are revised down only slightly for each year from 2013 to 2016, while the gain in the index for 2017 is now reported to be 0.8 percentage point lower than previously published.
Production by Industry Group
The output of durable goods manufacturers is now reported to have fallen in 2015, moved a little lower in 2016, and advanced in 2017; output was previously reported to have risen in 2016, and the rates of change for 2015 and 2017 were also revised down. Within durables, the revisions for the 2015 – 17 period were widespread across industries. Revisions to the rates of change for nondurables were smaller and more mixed. The revised estimates show the output of nondurables increasing about 1/2 percent in both 2015 and 2016 and rising 2.2 percent in 2017.
The output index for industries in scope for manufacturing IP that are not part of manufacturing under the North American Industry Classification System (NAICS) – that is, logging and publishing – fell sharply in 2014, 2016, and 2017, and was relatively little changed in other recent years. The revisions to this index were mixed, moving the rate of change higher in 2013, 2015, and 2016 and lower in 2014 and 2017.
Production by Market Group
The index for consumer goods has increased in each of the past few years, though the gains in 2014, 2015, and 2017 are now smaller than reported earlier. The rates of change for business equipment were revised down significantly for 2015 and 2016, but the gains were revised up for 2017. The revisions for construction supplies and business supplies were smaller. In addition, the index for materials is now estimated to have fallen more rapidly in 2015 and 2016 and risen more slowly in 2017, with downward revisions for both the energy and non-energy components.
Capacity
Total industrial capacity expanded modestly in each year from 2015 to 2017, and it is expected to increase about 2 percent in 2018. The growth rate for 2016 is now noticeably higher than the value reported earlier, but the gains in other years are now reported to have been smaller. Manufacturing capacity contracted slightly in 2014 and 2015, but it increased between 1/2 and 1 1/2 percent each year thereafter. For 2016 in particular, the gain in manufacturing capacity is larger than stated previously, reflecting a more-rapid increase in capacity for nondurables industries as well as a less-steep decline in capacity for logging and publishing (”other manufacturing” industries). Capacity at mines declined in 2016 and 2017, but it is expected to jump about 5 percent in 2018. As compared with previous reports, the growth of capacity at mines was significantly higher in 2016 and significantly lower in 2017. Capacity at utilities has grown in recent years; the gain for 2017 was revised up more than 1 percent, but revisions to other years were negative.
Capacity Utilization
Capacity utilization for total industry declined in 2015 and 2016 but rose in 2017.[3]The decrease in 2015 resulted from a large drop in the rate for mining and from smaller reductions in the rates for both manufacturing and utilities. Compared with earlier estimates, capacity utilization for total industry is now reported to have been somewhat higher for 2014, little changed in 2015, and lower for 2016 and 2017.
Utilization at manufacturers fell in 2016 and rose in 2017; the current readings for these years are each between about 1/2 and 1 percentage point lower than previously reported, as capacity revised down by less than output. For the fourth quarter of 2017, the utilization rate at manufacturers is estimated to have been more than 3 percentage points below its long-run average. Within manufacturing, there were sizable downward revisions to the utilization rates for both durables and nondurables for 2016 and 2017.
The utilization rate for durable manufacturing was above its long-run average in 2014, but it fell back in 2015. By the fourth quarter of 2017, the utilization rate for durables was more than 2 percentage points below its long-run average. Of the 11 major categories of durables, about half recorded operating rates below their long-run averages.
The utilization rate for nondurable manufacturing has been below its long-run average for several years. As of the fourth quarter of 2017, the operating rates for all nondurable manufacturing industry groups were around or below their industry-specific long-run averages.
Capacity utilization rates for mining declined sharply in 2015 and fell further in 2016, before rising sharply in 2017. The declines in 2015 and 2016 were largely due to decreased output in the oil and gas drilling and servicing sector. Relative to its previously published rates, utilization at mines for 2017 is about 2 percentage points higher; revisions to other recent years were smaller. In 2017, the utilization rate for mining was 1/2 percentage point above its long run average of 87.0 percent; it had last been above this average in 2014. The operating rates for utilities have been well below their long-run average for the past several years; the revisions to this index were positive except for 2017.