
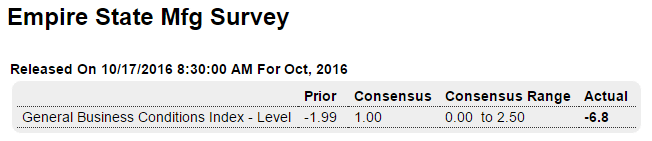
Well below expectations and further contraction:
Highlights
The first indication on October’s factory conditions is negative. The Empire State index is below zero for a third month in a row, at minus 6.80 vs similar readings in September and August. And the details are almost entirely negative with new orders at minus 5.60 for a second sub-zero score in a row. Shipments are at minus 0.60 with employment in reverse for a fourth straight month, at minus 4.70. Unfilled orders and inventories are almost always in contraction in the Empire State sample and they are again in the October report, in low double digits which is even weaker than usual.
But there are positive signs including life for prices. Input costs rose nearly 6 points to 22.60 which signals the greatest month-to-month pressure in more than 2 years, since September 2014. Pressure also appears in selling prices, which rose nearly 3 points to 4.70 for their best showing since July 2015. The 6-month outlook is also a positive, at a respectable 36.00 though down about 2 points from last month.
Positives aside, the trends in this report are pointing to continued sputtering for manufacturing, a sector that has been flat all year on weak demand for machinery and generally weak demand from overseas.
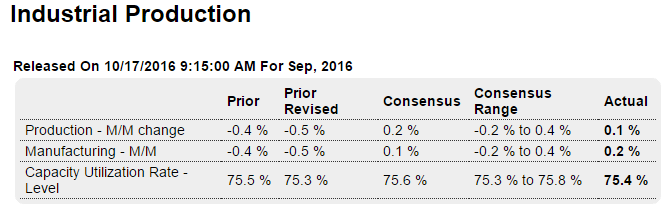
Nor is there any support for higher growth here:
Highlights
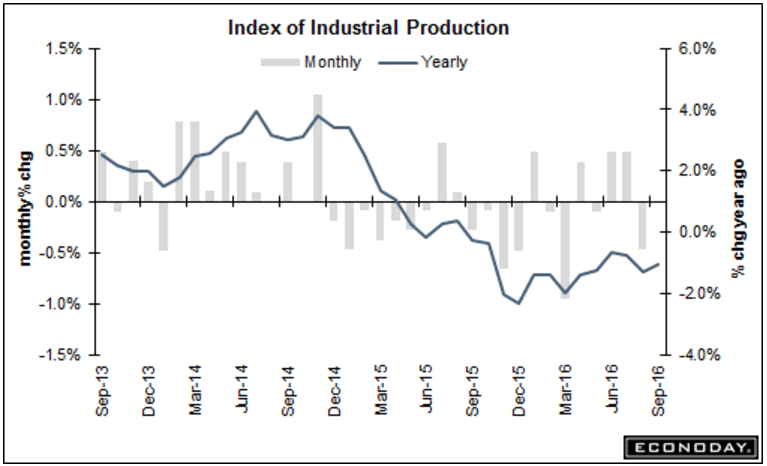
Flat is the best word to describe the factory sector right now. The latest evidence is the industrial production report which inched up only 0.1 percent in September with August revised 1 tenth lower to minus 0.5 percent. These two months follow, however, solid 0.5 percent gains in June and July which, when averaged all altogether however, extend what has been a flat two years for the industrial economy.
Manufacturing production did rise a nearly respectable 0.2 percent but follows a downwardly revised 0.5 percent decline in the prior month. Motor vehicle production, which was strong during the summer, was flat in September, up 0.1 percent. High-tech production bounced 0.6 percent higher to help drive the overall gain for manufacturing. A negative, however, is a second straight decline in business equipment, down 0.2 percent and 0.5 percent the last two reports.
Mining is a positive in the report, up 0.4 percent though following a 1.0 percent decline in August. Year-on-year, mining production is down 9.4 percent. Utility production is a negative in the September data, down 1.0 percent. Here, the year-on-year decline is only 0.4 percent. Capacity utilization came in at 75.4 percent vs a downwardly revised 75.3 percent in August.
Year-on-year, industrial production is down 1.0 percent with manufacturing dead even at zero percent. The 2014 collapse in oil prices and its hit on demand for energy equipment pulled the factory sector into low single digit contraction, which is where it continues to struggle.
Not looking so good for personal income numbers?
Highlights
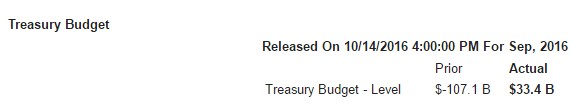
The Treasury ended its 2016 fiscal year with a surplus of $33.4 billion in September, one that however only shaves what is a 34 percent surge in the full-year deficit to $587.4 billion. Receipts were flat on the year, up only 0.6 percent as corporate income taxes, in part reflecting slowing profits, fell 12.9 percent. Individual income taxes, which make up the vast bulk of receipts, rose only 0.3 percent. The spending side rose 4.5 percent in the year, led by an 8.8 percent rise in Medicare and a 7.8 percent gain in net interest payments which reflects low rates overseas.
September 2016 Import Sea Container Counts Contraction Troubling
By Steven Hansen
Oct 15 (Econintersect) — This month exports trend lines accelerated further into positive territory – something positive is happening in international markets. On the other hand, imports are trending deeper into contraction – normally this is a sign of recession in the USA.