The lack of support from the lost oil capex continues to ripple out:
United States : Empire State Mfg Survey
Highlights
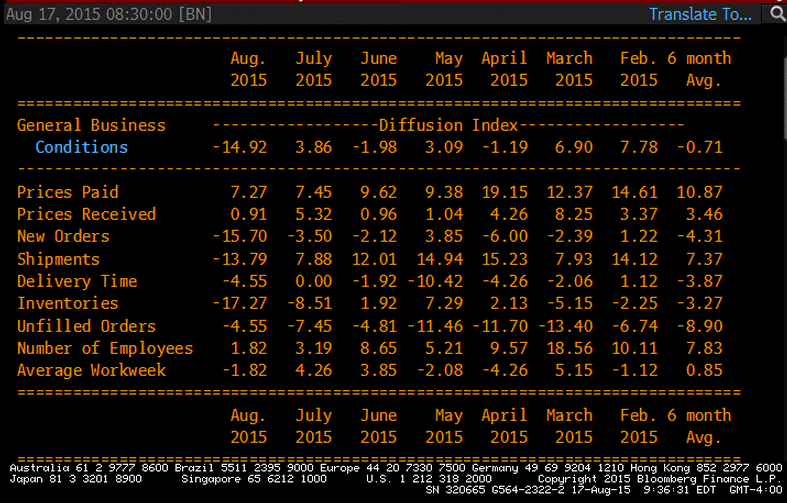
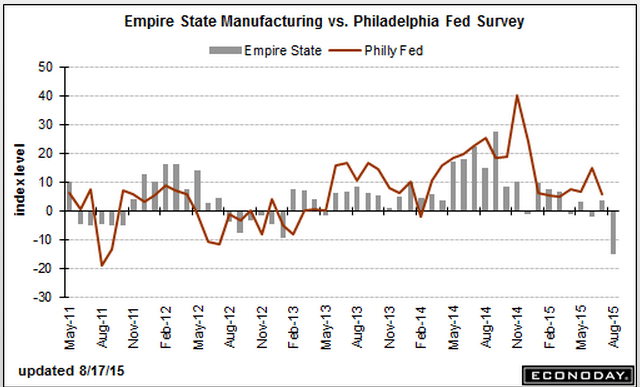
Out of the blue, the Empire State index has plunged deeply into negative column this month, to minus 14.92 in August vs plus 3.86 in July. This is by far the weakest reading of the recovery, since April 2009. New orders, which had already been weak in this report, fell from July’s minus 3.50 to minus 15.70 for the weakest reading since November 2010. Backlog orders, which had also been weak, came in at minus 4.55 from minus 7.45. Shipments, in the weakest reading since March 2009, fell to minus 13.79 from positive 7.99.
Last week’s industrial production report, boosted by the auto sector, offered hope but today’s report is a reminder that weak exports and weakness in the energy sector are stubborn negatives for the factory sector. Today’s results scramble the outlook for Thursday’s Philly Fed report which was expected to show moderate strength.

Home builders remain optimistic:
United States : Housing Market Index
Highlights
The new home sector is increasingly a central source of strength for the economy and builders are increasingly optimistic. The housing market index rose 1 point to a very strong 61 in August with the future sales component leading the way at 70. Current sales are at 66 with traffic continuing to lag but less so, at 45 for a 2 point gain in the month. By region, the South and West show the greatest composite strength at 63 each followed by the Midwest at 58 and the Northeast, which is the smallest region for new homes, still showing contraction at a sub-50 reading of 46.
Strength in the labor market is the driving force behind strength for new homes where lack of supply continues to motivate builders. Today’s report points to another strong housing starts report for tomorrow.
Never yet seen a positive trade balance and a weak currency, without an inflation problem. The euro is down only because of portfolio shifting, particularly CB’s, which may have run its course, and the general outlook remains deflationary. While this includes the (minority) non euro members, the trend is the same for just the ‘euro area’ which is also reported separately:
European Union : Merchandise Trade
Highlights
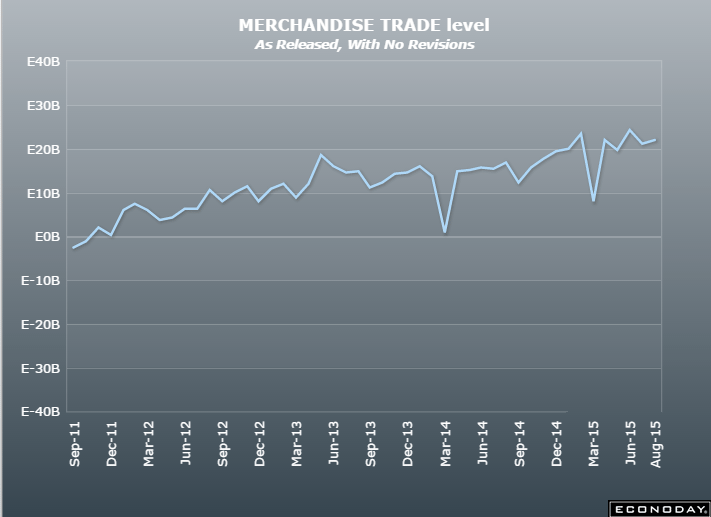
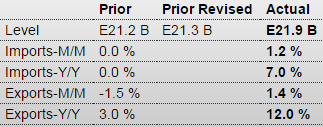
The seasonally adjusted trade balance was E21.9 billion, up from a revised E21.3 billion in May. Exports of goods to the rest of the world were €182.7 billion, an increase of 12 percent from a year ago. Imports from the rest of the world were E156.4 billion, 7 percent higher from a year ago. Intra-euro area trade rose to E151.2 billion in June 2015, up 10 percent compared with June 2014.
For the six months to June 2015, euro area exports of goods to the rest of the world rose 6 percent compared with January to June 2014), while imports were up 3 percent compared with the year earlier period.
Apart from the weakness of the oil market, the current soft level of the euro should help to ensure continued strong trade data over the rest of 2015.


