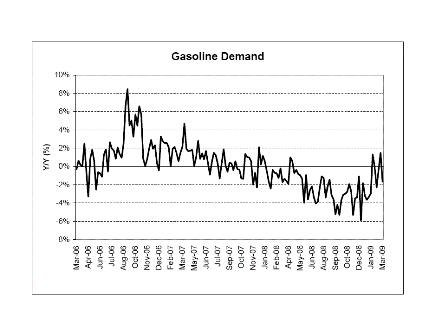
Year over year gasoline demand (in gallons) was down a bit this week still looks to be working its way higher since December.
Year over year changes are now very small, indicating little or no ‘demand destruction.’

[top]

Year over year gasoline demand (in gallons) was down a bit this week still looks to be working its way higher since December.
Year over year changes are now very small, indicating little or no ‘demand destruction.’

[top]