- Empire Manufacturing (Released 8:30 EST)
- Empire Manufacturing ALLX (Released 8:30 EST)
- Net Long-term TIC Flows (Released 9:00 EST)
- Total Net TIC Flows (Released 9:00 EST)
- TIC ALLX (Released 9:00 EST)
- TIC TABLE 1 (Released 9:00 EST)
- TIC TABLE 2 (Released 9:00 EST)
- TIC TABLE 3 (Released 9:00 EST)
- Industrial Production MoM (Released 9:15 EST)
- Industrial Production YoY (Released 9:15 EST)
- Capacity Utilization (Released 9:15 EST)
- Capacity Utilization TABLE 1 (Released 9:15 EST)
- Capacity Utilization TABLE 2 (Released 9:15 EST)
- Capacity Utilization TABLE 3 (Released 9:15 EST)
- U of Michigan Confidence (Released 10:00 EST)
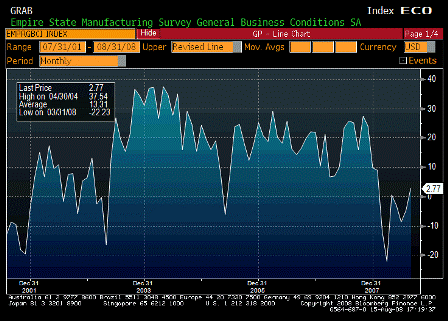
Empire Manufacturing (Aug)
| Survey | -4.0 |
| Actual | 2.8 |
| Prior | -4.9 |
| Revised | n/a |
Yet another series that could be making a comeback, albeit from very low levels.
Even the work week went up.
Prices paid still way high, and prices received high and moved higher.
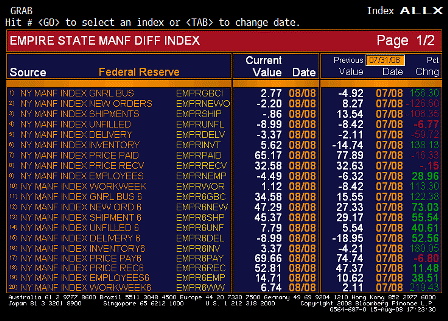
Empire Manufacturing ALLX (Aug)
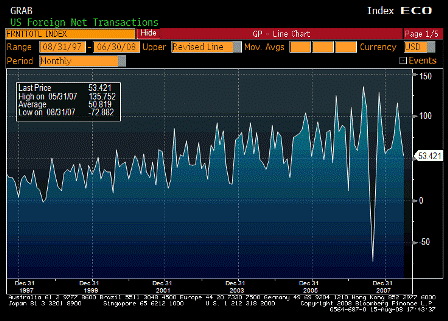
Net Long-term TIC Flows (Jun)
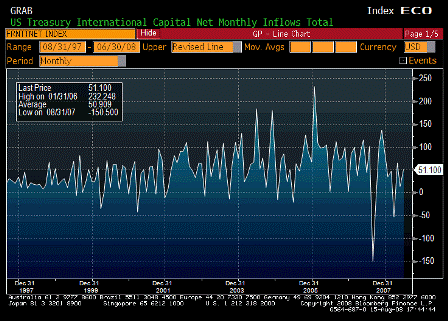
Total Net TIC Flows (Jun)
| Survey | n/a |
| Actual | $51.1B |
| Prior | -$2.5B |
| Revised | $12.3B |
Should be slowing with trade flows reversing.
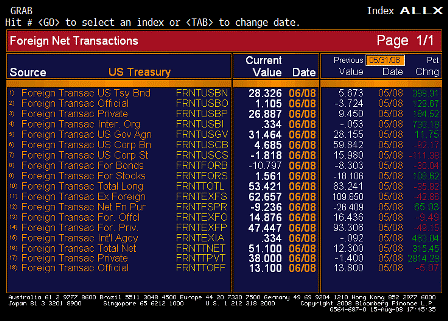
TIC ALLX (Jun)
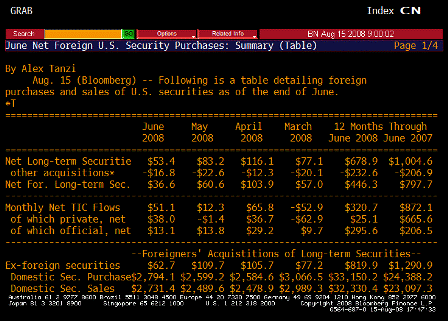
TIC TABLE 1 (Jun)
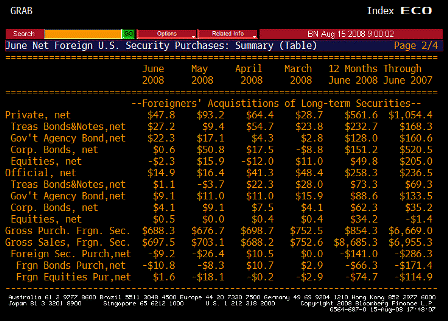
TIC TABLE 2 (Jun)
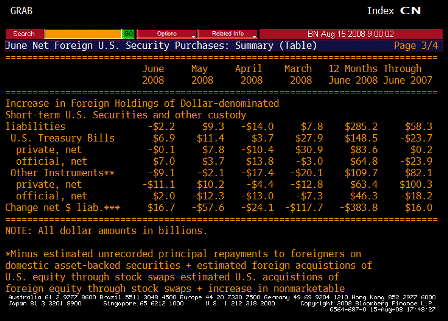
TIC TABLE 3 (Jun)
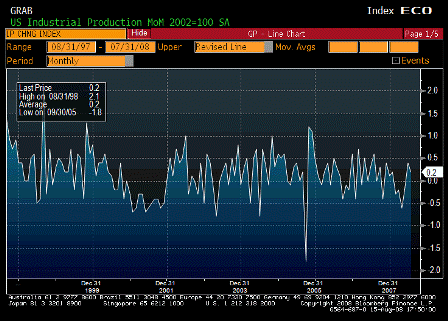
Industrial Production MoM (Jul)
| Survey | 0.0% |
| Actual | 0.2% |
| Prior | 0.5% |
| Revised | 0.4% |
A little better than expected.
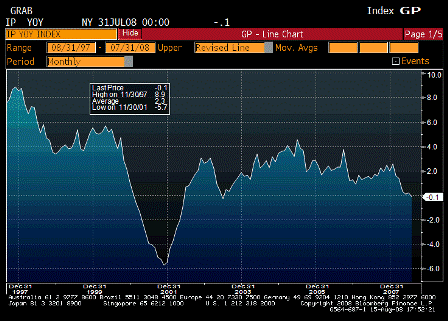
Industrial Production YoY (Jul)
| Survey | n/a |
| Actual | -0.1% |
| Prior | 0.2% |
| Revised | n/a |
Certainly not a collapse.
Being helped by the relatively weak USD.
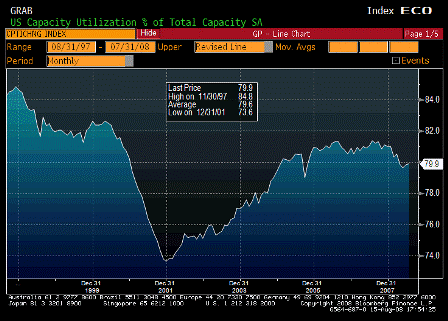
Capacity Utilization (Jul)
| Survey | 79.8% |
| Actual | 79.9% |
| Prior | 79.9% |
| Revised | 79.8% |
No collapse here either.
The Fed’s counting on slack to bring prices down.
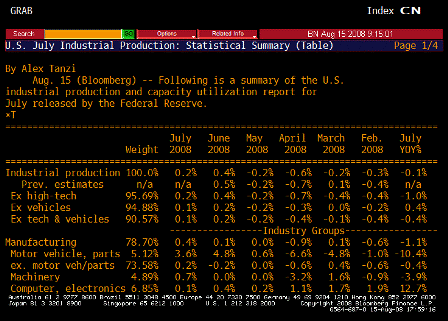
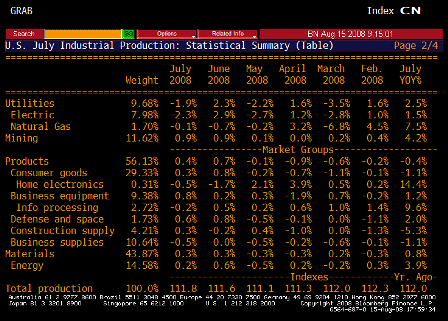
Capacity Utilization TABLE 2 (Jul)
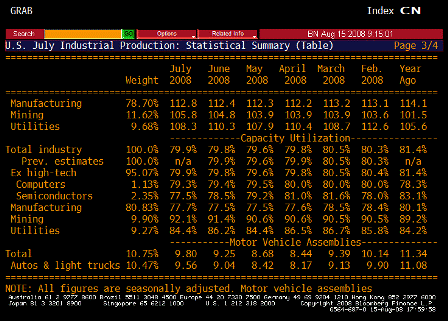
Capacity Utilization TABLE 3 (Jul)
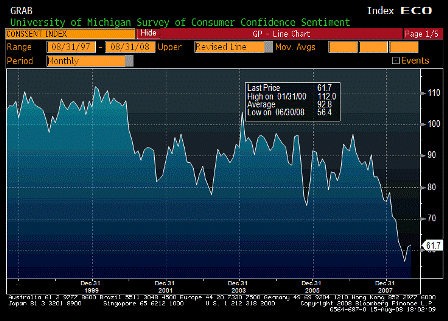
U of Michigan Confidence (Aug P)
| Survey | 62.0 |
| Actual | 61.7 |
| Prior | 61.2 |
| Revised | n/a |
This too looks like it has bottomed from very low levels.
‘Inflation’ still hurting confidence.
[top]


