Saudi crude output, Crude price cuts and deflation

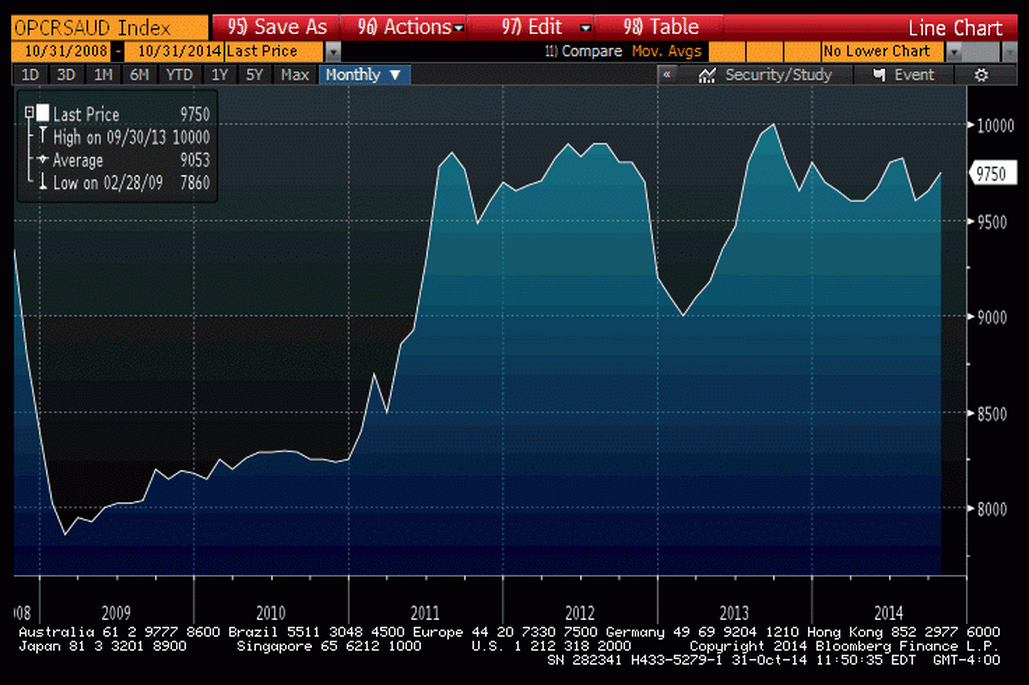
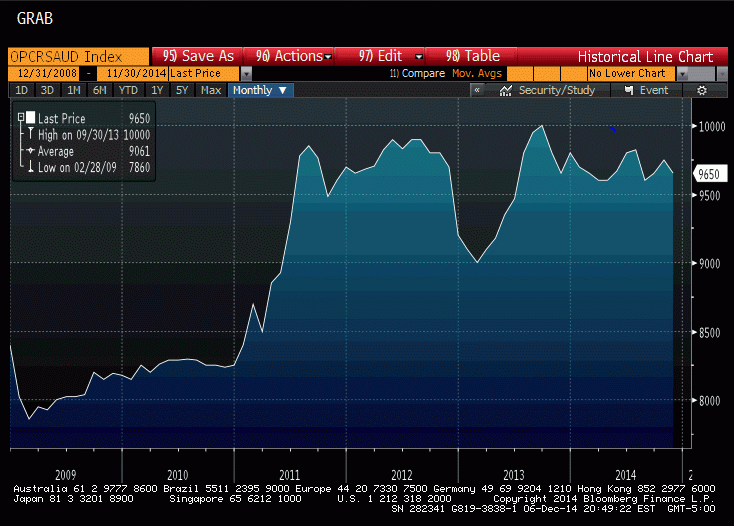
Saudis post prices for refiners, then let them buy all they want at those prices. The chart shows the ‘residual demand’ for crude oil has been reasonably steady, indicating that the price did not move due to any kind of a ‘supply glut’ but to Saudi pricing:

saudi-nov

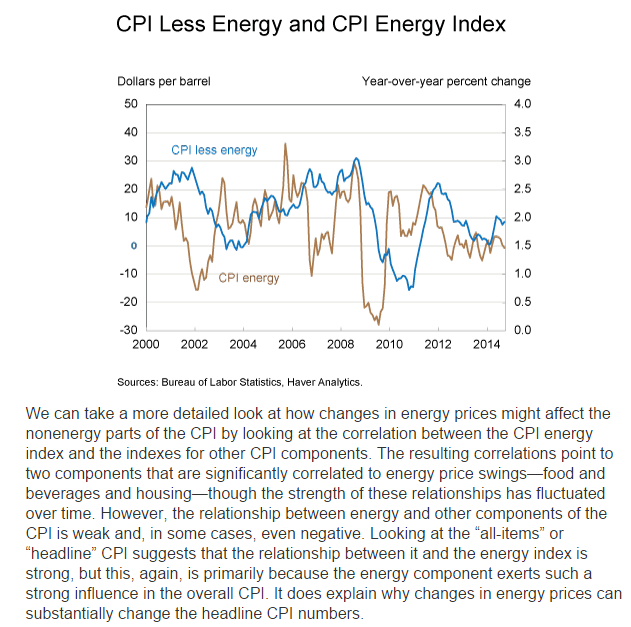
To my point about crude price cuts triggering a general deflation, this is from the Cleveland Fed. Note that in 2008 the price of crude went to 35 but only briefly. My concern is that if crude were to stay low the deflationary effect would continue perhaps until prior relative value was restored:

Since the CPI is most directly influenced by oil price changes through its energy component, one question that remains is whether or not other components in the CPI are influenced by low oil prices. Generally, energy prices are rather volatile, and so energy components are often excluded when predicting inflation because of that volatility. Forecasters focus on “core” measures instead. The recent decline in oil prices is of less concern to many CPI forecasters, because it may not affect the “core” price level. It would be a bit more concerning, however, if low oil prices also affected other domestic prices as well. A quick look at the year-over-year percent changes in the energy CPI and the CPI excluding energy suggests changes in energy prices are often followed by similar changes in the rest of the CPI’s components.

core-cpi

November budget review-up slightly year over year for November

From the Congressional Budget Office:

The federal government’s budget deficit was $181 billion for the first two months of fiscal year 2015, $45 billion less than the shortfall recorded in October and November of last year, CBO estimates. That outcome was affected by shifts in the timing of certain payments. Without those shifts, the deficit would have declined by just $9 billion.

Estimated Deficit in November 2014: $59 Billion

CBO estimates that the government recorded a deficit of $59 billion in November 2014—$76 billion less than the deficit in November 2013. But shifts in the timing of certain payments (because the regular payment dates fell on weekends) boosted spending in November 2013 and reduced it in November 2014. Without those shifts, the November 2014 deficit would have been $3 billion more than the November 2013 deficit.

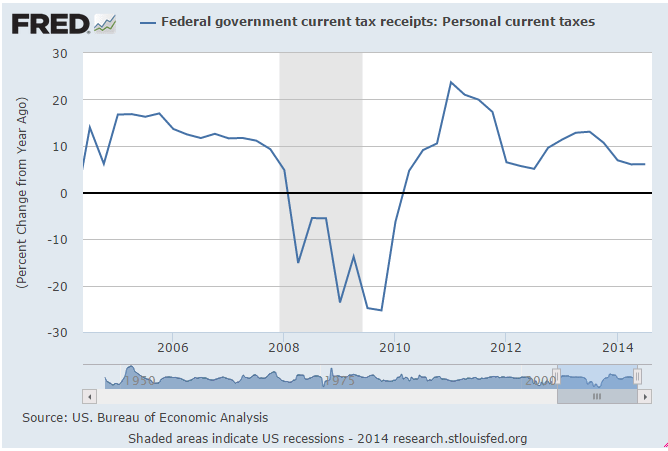
Individual income taxes and payroll taxes together increased by $5 billion (or 2 percent); a $4 billion increase in withheld taxes explains nearly all of that change.

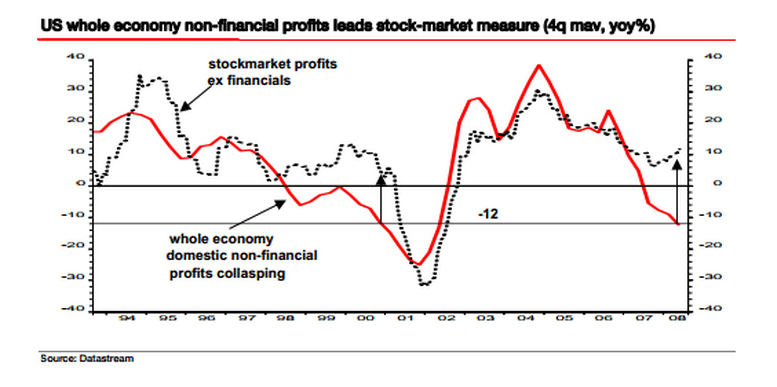
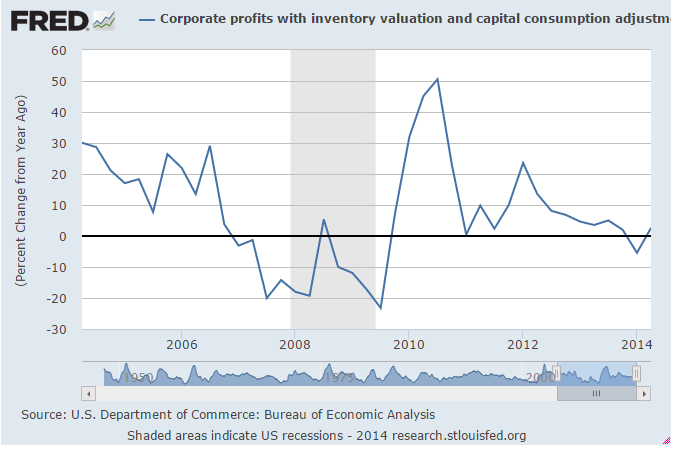
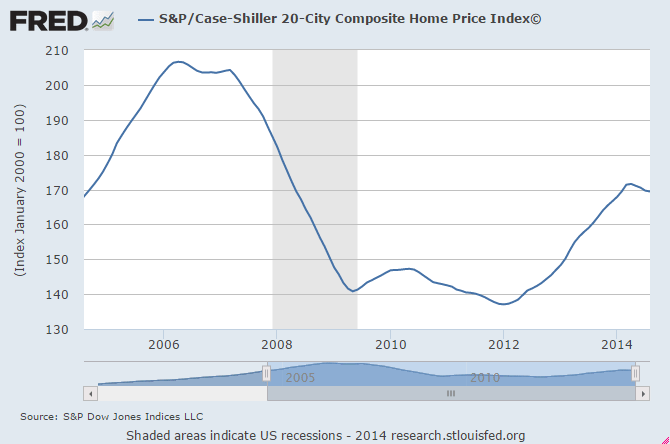
This is quarterly data released a couple of weeks ago. You can see the growth had slowed to 6.1%, and now most recently is down to 2%, which is a red flag for negative GDP growth:

fed-def

labor force discussion

Note the labor force grew continuously then hit a brick wall with the collapse in aggregate demand in 2008 and has yet to resume it’s prior rate of growth. This has all been attributed to ‘demographics’ by the mainstream:
lf-1

This is the same chart but just for the last year. Note the drop off at the end of 2013 as cold weather hit and subsequent increase through the peak in April when the new jobs report peaked as well.
lf-2

So what’s happened is that most new hires came from ‘new entries’ into the labor force rather than the ‘unemployed’ and unemployment has gone down largely as a function of the growing labor force. The participation rate tells the same story:
lf-3

New jobs peaked in April and have been working their way lower. We’ll see Friday if that continues.
lf-4

Ecri

Because the ECRI forecast a recession a few years ago during a spate of weakness it’s being ignored this time. The difference is, as previously discussed, last time the deficit was running around 9% of GDP, while this time it’s at a recession friendly sub 3% of GDP:

21 November 2014: ECRI’s WLI Improves Marginally But Remains in Contraction

ECRI’s WLI Growth Index improved marginally but has been in negative territory for 6 weeks. This index is forecasting a slight business cycle contraction in 1Q2015. Obviously the markets do not share ECRI’s view the business cycle is taking a downturn.

Obama- small govt conservative champion!

Also interesting: For the first time since 2008, the public sector will add jobs in 2014.  State and local governments started adding a few jobs last year, but austerity has been ongoing at the Federal level.  According to the WSJ The Federal Government Now Employs the Fewest People Since 1966

Not since July 1966 has the federal government’s workforce been so small. … But that’s only the raw numbers! As a share of the total workforce … data going back to 1939 would show no point where the federal government’s share of employment was so low.

In the last 75 years (when the BLS started tracking the data), the public sector (non-military) shed jobs in 12 years. Three of those years were at the end of WWII, two in the early ’80s, and the last five consecutive years (unprecedented streak since the Great Depression).

Construction spending, ISM manufacturing

Another setback for construction, which a ‘borrowing to spend’ item:

Construction Spending

cons-spending
Highlights
Construction outlays unexpectedly declined in September on public outlays and somewhat on the private nonresidential component. Private residential spending was a positive for the month. . Construction spending declined 0.4 percent in September after a 0.5 percent decrease in August. Market expectations were for a 0.6 percent boost.

const-spending

Meanwhile, manufacturing is chugging along as it usually is:

ISM Mfg Index

ISM-table
Highlights
The ISM report stands out starkly from the net result of other anecdotal surveys on October’s manufacturing sector, showing outstanding growth at a composite index of 59.0 vs 56.6 in September. This level matches August’s level with the two the strongest since February 2011.

New orders, the most important reading in the report, rose a strong 5.8 points to a blistering 65.8. This points to rising activity across the supply chain in the months ahead. Export orders slowed in the month, as they did for Markit’s sample released earlier this morning, which implies that domestic demand is especially strong. In two signs of strength, total backlog orders rose while supplier deliveries, reflecting ongoing congestion in the supply chain, slowed.

Production, at 64.8, is strong and in line with orders. Inventories show slight accumulation. Price pressures moderated as they have in most reports for October, the result of lower oil prices.

This report may be just a bit too strong, given that ISM’s data have not been tracking well this year with hard data on the manufacturing sector where growth has been flat.

ism-graph

Mortgage Purchase Applications Fall Even Further

This continuing decline is particularly troubling as cash buyers are also on the decline, and home sales are already at severely depressed levels by any measure.

Furthermore, prices have also been falling month to month, and the year over year gains are heading towards negative territory as well.

This cycle may now be over.

With the federal deficit this low in the context of today’s credit conditions, income lost in one slow period is a drag on the next period, as credit expansion can’t keep up with unspent incomes and it all goes into reverse.

MBA Purchase Applications

mort-table

Highlights
The big drop this month in mortgage rates has yet to raise demand for purchase applications which, in the October 24 week, fell a sharp 5.0 percent for the second straight week. And the trend for purchase applications is suddenly moving lower with the year-on-year rate, which had been in the low negative double-digits, now at minus 15 percent.

From the MBA: Mortgage Applications Decrease in Latest MBA Weekly Survey

Mortgage applications decreased 6.6 percent from one week earlier, according to data from the Mortgage Bankers Association’s (MBA) Weekly Mortgage Applications Survey for the week ending October 24, 2014. …

The Refinance Index decreased 7 percent from the previous week. The seasonally adjusted Purchase Index decreased 5 percent from one week earlier. … The seasonally adjusted purchase index and conventional purchase index were the lowest since February 2014, while the government purchase index was the lowest since August 2007.

MBAOct292014 sp-cs