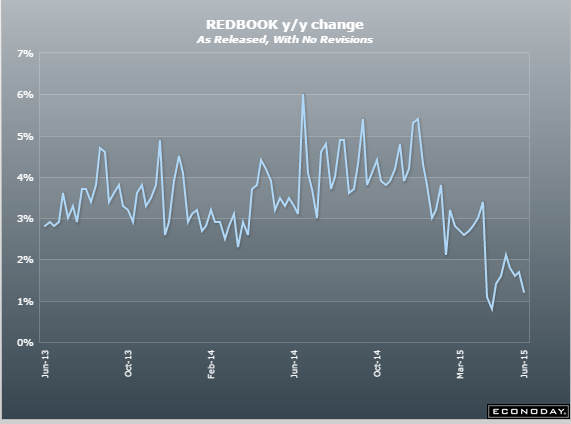
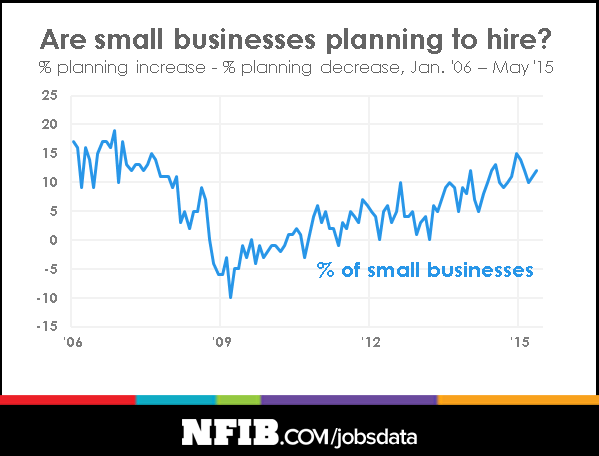
Getting worse instead better in Q2:
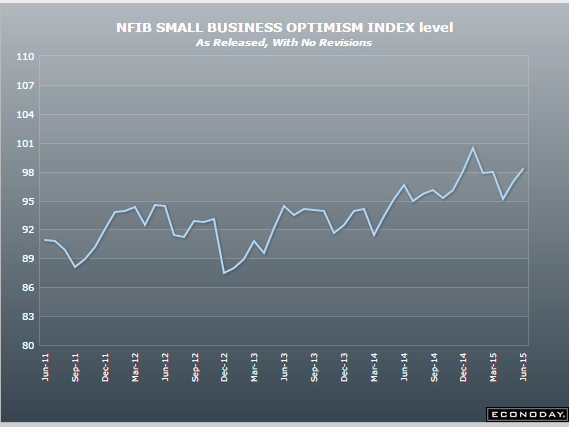
It’s up which is good, but not even back to q1 January high and below historic ‘good economy’ levels:
NFIB Small Business Optimism Index
Highlights
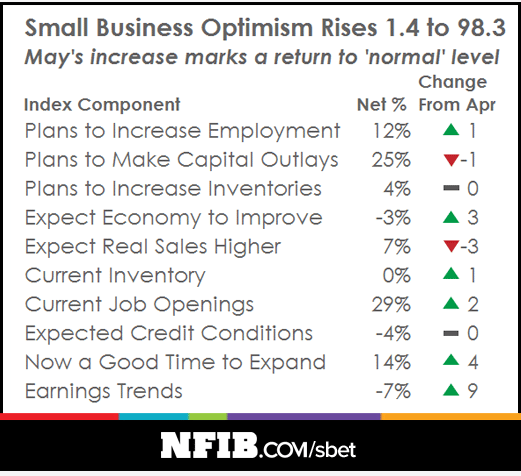
The small business optimism index came in well above expectations, at 98.3 for a very solid 1.4 point gain from April’s 96.9 and compared with the Econoday consensus for 97.2. The gain is centered right where small business owners need it the most, in earnings trends. The gain here in turn is lifting the small business outlook with more saying this is now a good time to expand. The outlook on the general economy is also up as are job readings. This report hints at the big second-quarter rebound that many have been expecting.
Calculated Risk:
From the National Federation of Independent Business (NFIB):Small business optimism level is finally back to a normal levelThe Index of Small Business Optimism increased 1.4 points to 98.3 … May is the best reading since the 100.4 December reading but nothing to write home about. The 42 year average is 98.0 … Eight of the 10 Index components posted improvements.

QE comment:
This gets to the bottom it- if the total number of securities outstanding remains unchanged, QE has done nothing apart from removing about $100b of interest income from the economy each year and maybe some repricing of financial assets. That is, at the macro level portfolios can’t be increasing risky assets if the total isn’t increasing:
Antonin Jullier, global head of equity trading strategy at Citi, told CNBC Tuesday that the bond-buying policies implemented by central banks including the Federal Reserve and European Central Bank had had a detrimental effect.
“The lack of liquidity is coming from QE, it’s one of the consequences…it’s sucking it out,” he said.
The aggressive stimulus was “one-sided,” according to Jullier, who said it was increasing valuations of securities, but not producing more stock flotations or capital increases.
“The net inventory of securities has actually been flat for years now. So there are no new securities available,” he added, calling it a period of “de-equitization.”
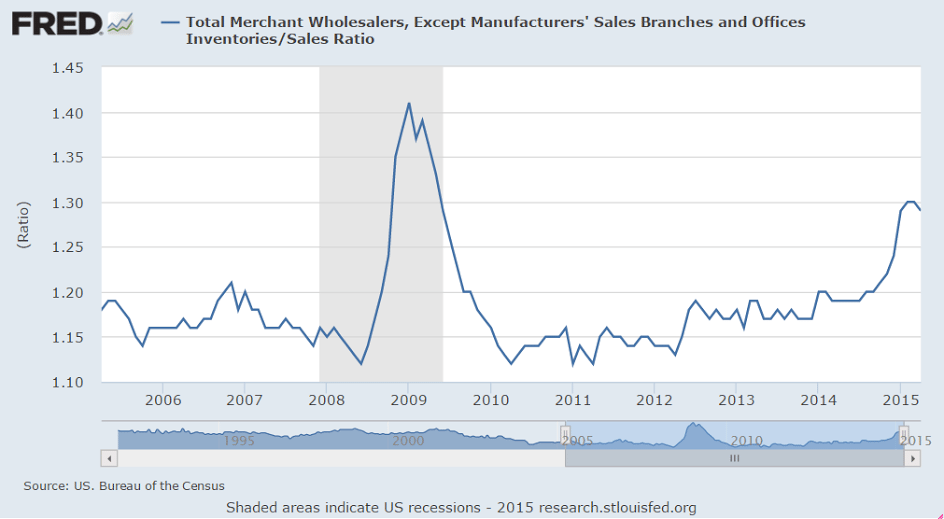
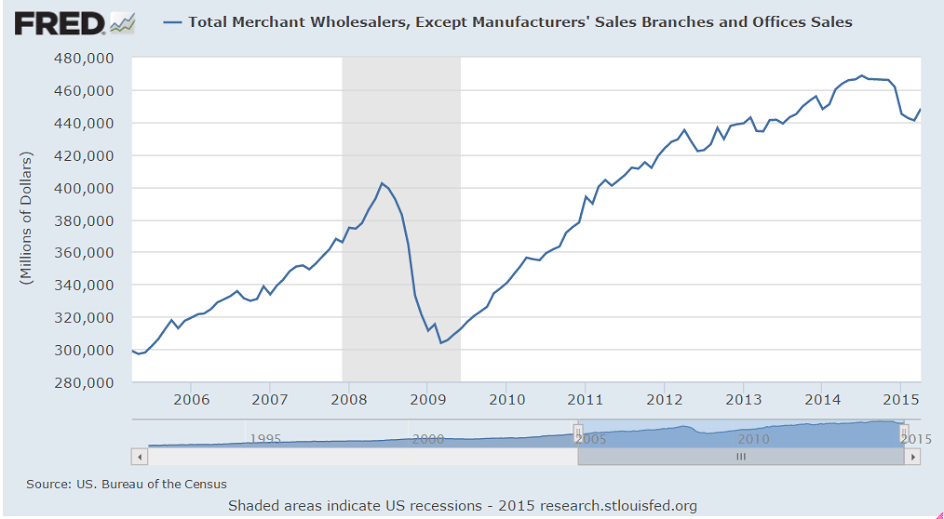
Inventories up more than expected which adds to Q2 GDP, but it’s still an inventory build and the inventory/sales ratio is still too high historically, which doesn’t bode well for production. The sales growth is a positive but a small rebound from prior declines, which is good for Q2 vs /Q1, but it’s an April read with 2 months to go.
Wholesale Trade
Highlights
Inventories relative to sales lightened up in the wholesale sector during April with inventories up 0.4 percent but far below a giant 1.6 percent surge in sales. The stock-to-sales ratio edged down to 1.29 from 1.30. Autos, where sales have been strong, show a sizable decline in the stock-to-sales ratio as do farm products, furniture, computer equipment, and electrical goods. All these categories, like autos, show strong sales gains in the month.
Early indications on second-quarter inventories have been favorable with the risk of overhang, evident in the first quarter, now easing. Watch Thursday for the business inventories report which will round out related data for April.
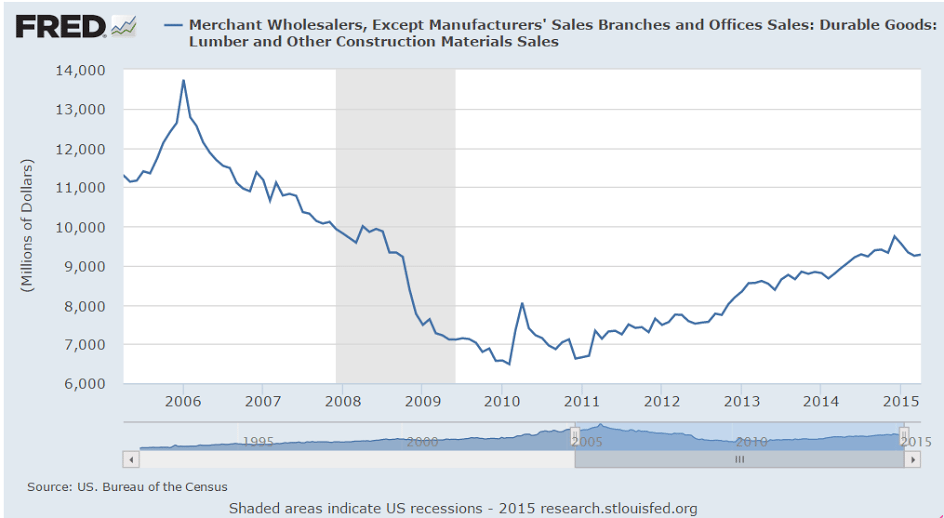
And this doesn’t say much for construction prospects:
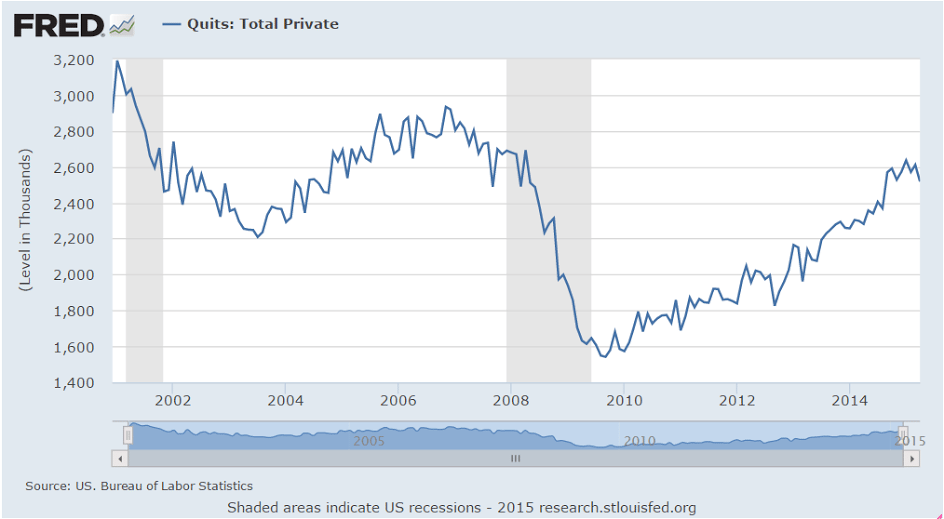
Another mixed bag with openings higher but actual hires pretty much flat as were quits:
Job Openings and Labor Turnover Summary
The number of job openings rose to 5.4 million on the last business day of April, the highest since the series began in December 2000, the U.S. Bureau of Labor Statistics reported today. The number of hires was little changed at 5.0 million in April and the number of separations was little changed at 4.9 million. …
Quits are generally voluntary separations initiated by the employee. Therefore, the quits rate can serve as a measure of workers’ willingness or ability to leave jobs. … There were 2.7 million quits in April, little changed from March.
Hires may have even peaked:
JOLTS
Highlights
The hawks have something to talk about with the April JOLTS report where job openings surged to 5.376 million, far above the Econoday consensus for 5.038 million and the high estimate at 5.050 million. This is the highest reading in the history of the series going back to 2000. Year-on-year, openings are up an eye-popping 22 percent!
And the report includes a big upward revision for March, to 5.019 million vs an initial 4.994 million. April’s job openings rate rose to 3.7 percent from 3.5 percent.
This report will boost talk among the hawks that slack in the labor market is evaporating and that employers will have to raise wages to fill positions. Other readings include a tick lower for the quits rate, to 1.9 percent, and a tick lower for the separations rate, to 3.5 percent from 3.6 percent.
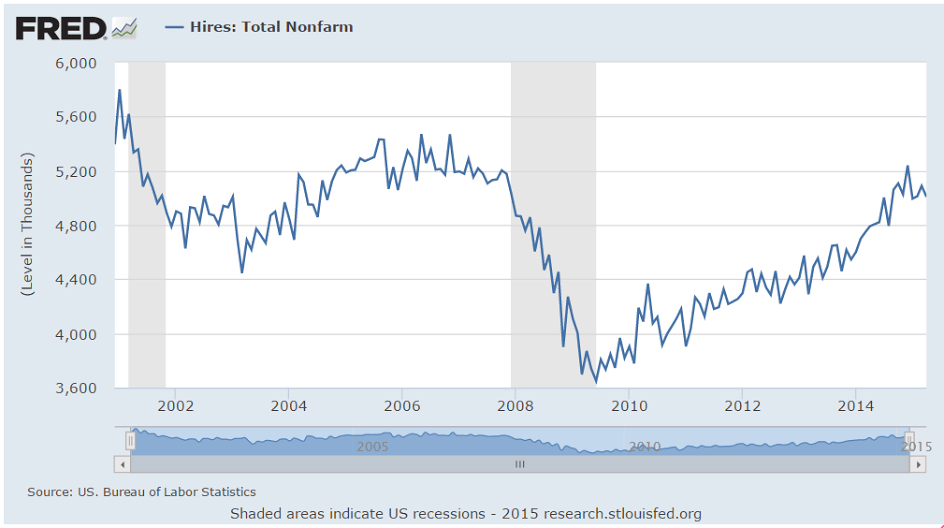
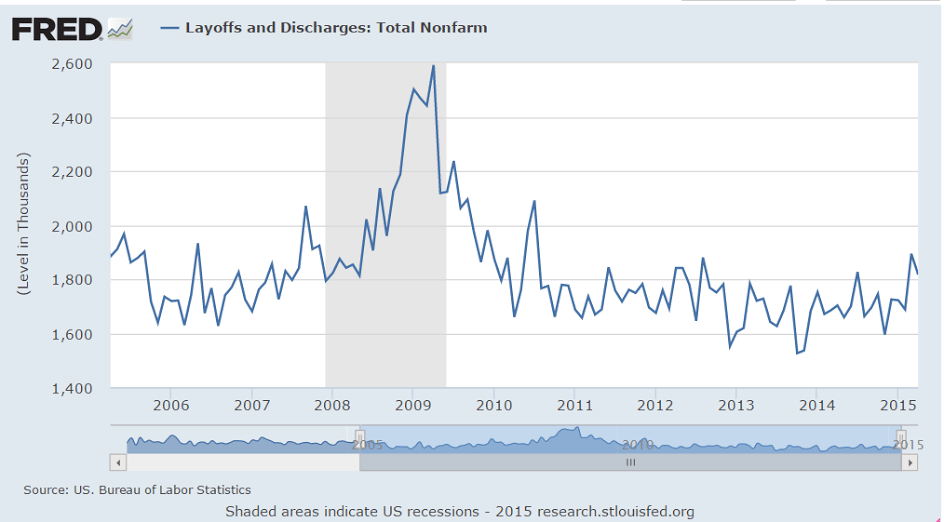
And you can see how much of a lagging indicator this stuff can be: