
A few charts/comments below. More after the first revision to Q2 come out. Looks to me like the macro constraint narrative is still intact.
Just a word here about state and local govt spending adding to GDP. Yes, there was an increase in spending. But tax receipts also went up, which subtracts from private spending. The thing to watch is net state and local spending, including borrowing to spend. I don’t have any charts, but anecdotally state and local budgets are said to be ‘improving’ which means less net spending.
GDP
Highlights
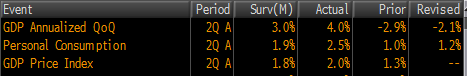
The second quarter rebounded more than expected from the adverse weather impacted first quarter. While there were a number of strong components, the rebound was led by inventory growth. The advance estimate for the second quarter posted at a healthy 4.0 percent annualized, following an upwardly revised decline of 2.1 percent in the first quarter (previously down 2.9 percent). The median forecast was for 3.1 percent. Today’s release includes annual revisions.
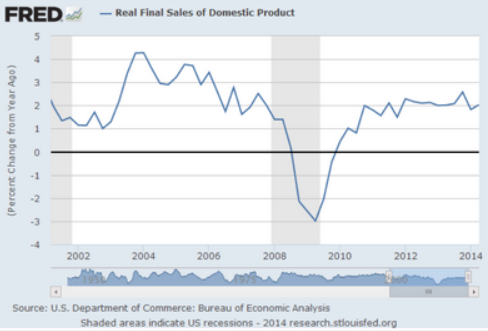
Final sales of domestic product rebounded 2.3 percent after dipping 1.0 percent in the first quarter. Final sales to domestic purchasers gained 2.8 percent in the second quarter, compared to 0.7 percent in the first quarter.
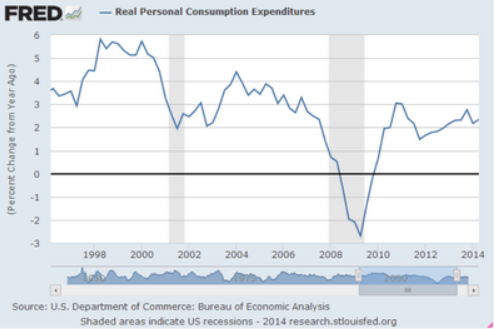
Turning to components, inventory investment jumped $93.4 billion after rising $35.2 billion in the first quarter. Importantly, personal spending posted a robust 6.2 percent gain, following a 1.0 percent rise in the prior quarter. Durables PCEs were particularly strong with nondurables healthy. Services posted on the soft side.
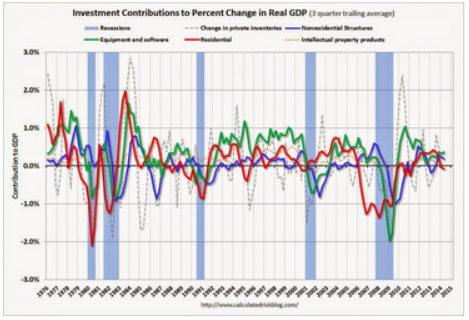
Residential investment rebounded notably in the second quarter and nonresidential investment was healthy. Government purchases were up but soft and net exports worsened notably.
On the price front, the chain-weighted price index firmed to a 2.0 percent increase, up from 1.3 percent in the first quarter. The core chain index increased 1.8 percent in the second quarter from 1.2 percent in the prior quarter.
Turning to annual revisions, 2013 on an annual average basis was revised up to 2.2 percent versus the prior estimate of 1.9 percent; 2012 revised down to 2.3 percent from 2.8 percent; and 2011 revised down to 1.6 percent from 1.8 percent.
Overall, the second quarter numbers point to a return to forward momentum after the deep freeze first quarter. While inventories led second quarter growth, this should not be disconcerting as the lack of production in the first quarter meant that significant inventory rebuilding was needed. Additionally, other GDP components (net exports being the key exception) were healthy.
Full size image
Average basic monthly wage posts 1st gain in June in over 2 years
July 31 (Kyodo) — The average basic monthly salary at companies with at least five employees rose 0.3 percent in June from a year earlier to 243,019 yen, marking the first rise in two years and three months, the labor ministry said Thursday. This year’s “shunto” spring labor offensive resulting in many unions winning a pay-scale increase pushed up the figure, according to the Health, Labor and Welfare Ministry. The total monthly average, including bonuses, increased 0.4 percent to 437,362 yen. Nonscheduled cash earnings, such as overtime compensation, grew 1.9 percent to 19,058 yen. Real wages, adjusted for inflation, decreased 3.8 percent, down over 3 percent for the third consecutive month following the consumption tax hike in April.