- Personal Income MoM (Released 9:30 EST)
- Personal Income YoY (Released 9:30 EST)
- Personal Income ALLX (Released 9:30 EST)
- Personal Consumption MoM (Released 9:30 EST)
- Personal Consumption YoY (Released 9:30 EST)
- PCE Deflator YoY (Released 9:30 EST)
- PCE Core MoM (Released 9:30 EST)
- PCE Core YoY (Released 9:30 EST)
- Employment Cost Index (Released 9:30 EST)
- Employment Cost Index ALLX (Released 9:30 EST)
- RPX Composite 28dy YoY (Released 10:00 EST)
- RPX Composite 28dy Index (Released 10:00 EST)
- Chicago Purchasing Manager (Released 10:45 EST)
- NAPM Milwaukee (Released 11:00 EST)
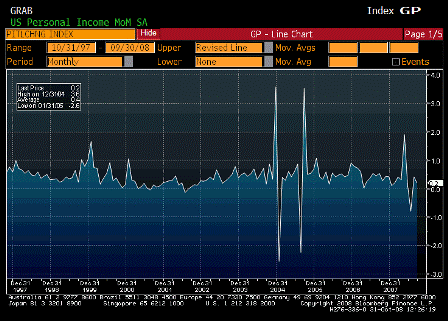
Personal Income MoM (Sep)
| Survey | 0.1% |
| Actual | 0.2% |
| Prior | 0.5% |
| Revised | 0.4% |
A tick better than expected but last month revised down same.
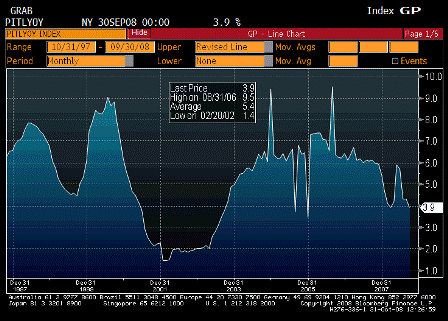
Personal Income YoY (Sep)
| Survey | n/a |
| Actual | 3.9% |
| Prior | 4.3% |
| Revised | n/a |
Looks to be on the decline as expected.
Lower interest rates are also a drag on income, as households are net savers.
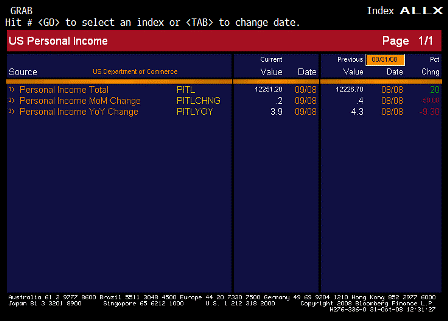
Personal Income ALLX (Sep)
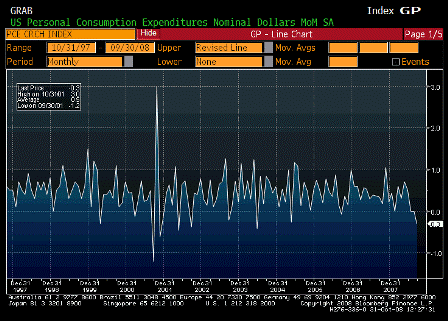
Personal Consumption MoM (Sep)
| Survey | -0.2% |
| Actual | -0.3% |
| Prior | 0.0% |
| Revised | n/a |
Worse than expected and took dive as the publicity around the credit crisis petrified businesses and consumers.
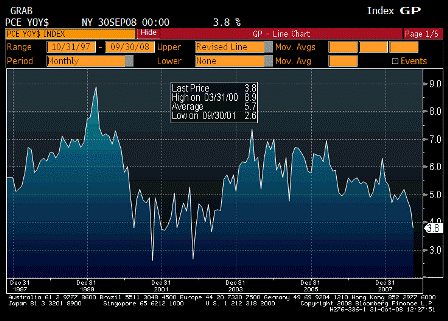
Personal Consumption YoY (Sep)
| Survey | n/a |
| Actual | 3.8% |
| Prior | 4.5% |
| Revised | n/a |
Heading south but still growing some.
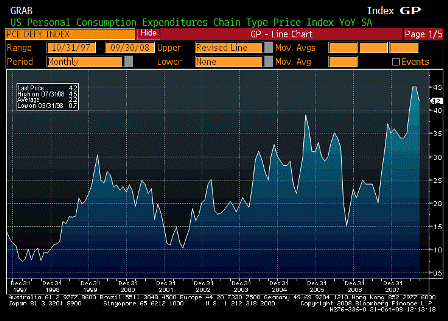
PCE Deflator YoY (Sep)
| Survey | 4.1% |
| Actual | 4.2% |
| Prior | 4.5% |
| Revised | n/a |
Higher than expected and staying high even with commodities coming down.
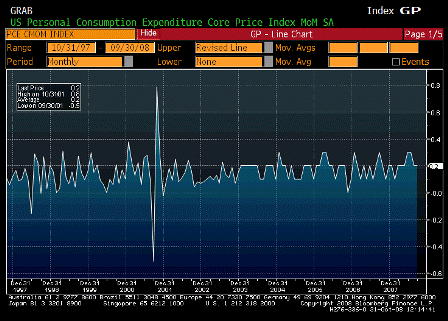
PCE Core MoM (Sep)
| Survey | 0.1% |
| Actual | 0.2% |
| Prior | 0.2% |
| Revised | n/a |
Higher than expected.
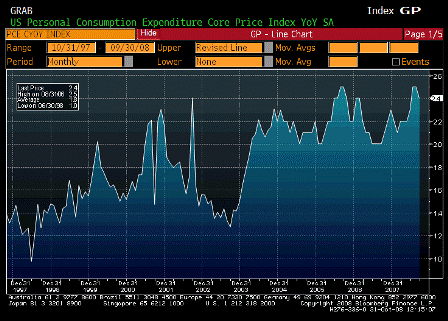
PCE Core YoY (Sep)
| Survey | 2.4% |
| Actual | 2.4% |
| Prior | 2.6% |
| Revised | 2.5% |
Holding firm, at least for now.
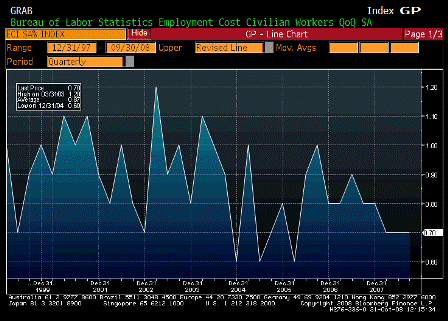
Employment Cost Index (3Q)
| Survey | 0.7% |
| Actual | 0.7% |
| Prior | 0.7% |
| Revised | n/a |
Well contained.
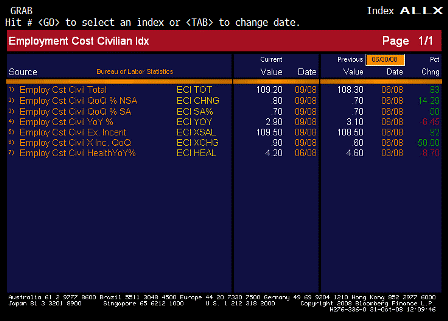
Employment Cost Index ALLX (3Q)
The surveys have a large subjective component, and have all taken dives recently.
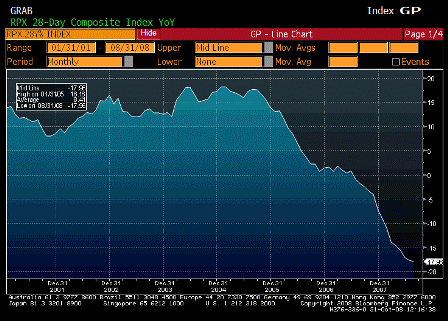
RPX Composite 28dy YoY (Aug)
| Survey | n/a |
| Actual | -17.96% |
| Prior | -17.76% |
| Revised | n/a |
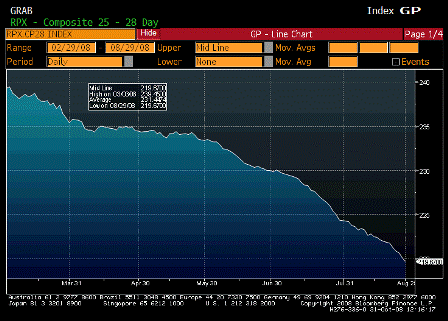
RPX Composite 28dy Index (Aug)
| Survey | n/a |
| Actual | 219.67 |
| Prior | 224.28 |
| Revised | n/a |
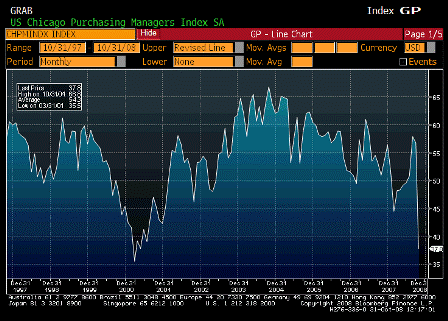
Chicago Purchasing Manager (Oct)
| Survey | 48.0 |
| Actual | 37.8 |
| Prior | 56.7 |
| Revised | n/a |
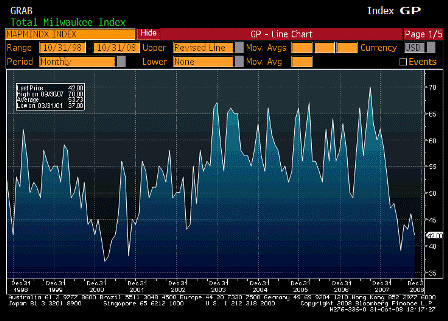
NAPM Milwaukee (Oct)
| Survey | n/a |
| Actual | 42.0 |
| Prior | 46.0 |
| Revised | n/a |
[top]


