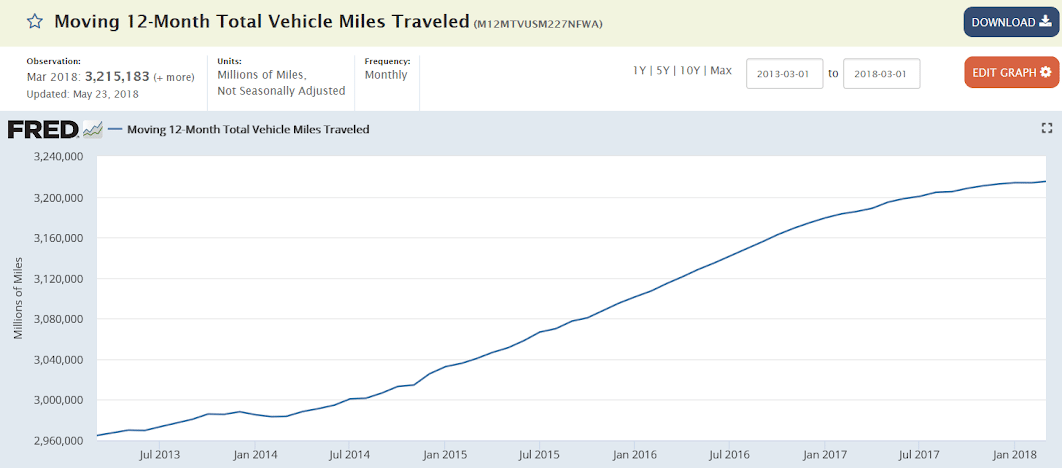
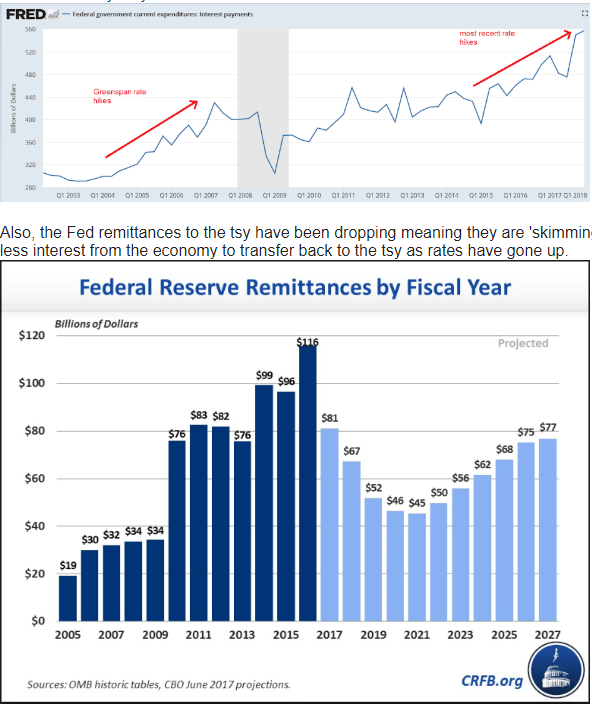
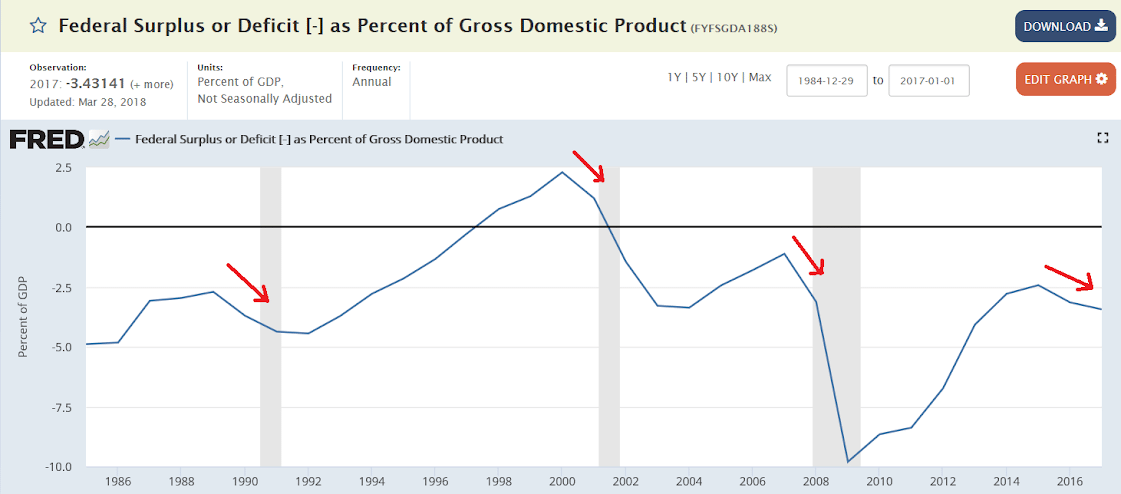
A weaker than expected print due to auto sales which have been volatile, but charts show it’s still chugging along at a modest pace:

Highlights
A big drop in autos skewed industrial production lower in May, slipping 0.1 percent and missing what was an already soft consensus by 2 tenths. Manufacturing volumes fell a very steep 0.7 percent, pulled down by a 6.5 percent monthly drop in motor vehicles that itself reflected the effects of a fire early in the month at a supplier in Michigan.
Yet readings outside autos are also soft with hi-tech production up only 0.2 percent and production of business equipment down 1.1 percent. Excluding autos, manufacturing production fell 0.2 percent in the month. The manufacturing component of this report never really has shown the kind of strength being posted by factory shipments or factory orders.
Manufacturing makes up the great bulk of industrial production and once again is overshadowing another standout month for mining which surged 1.8 percent. Year-on-year mining production is up 12.6 percent vs only a 1.7 percent rate for manufacturing. Utility production has been mixed, up 1.1 percent in May for 4.0 percent yearly growth.
Capacity utilization is over 90 percent for mining at 92.4 percent vs 79.4 percent for utilities and 75.3 percent for manufacturing. Utilization overall, down 2 tenths to 77.9 percent, is not extreme and points to available slack in the industrial sector.
Putting mining and utilities aside, industrial production is once again an anomaly, not pointing as other reports to building strength and a rising tempo for the nation’s factory sector.
Note that traditional non-NAICS numbers for industrial production may differ marginally from NAICS basis figures.


Growth slowing:


Will the tax cuts and spending increases save us?


