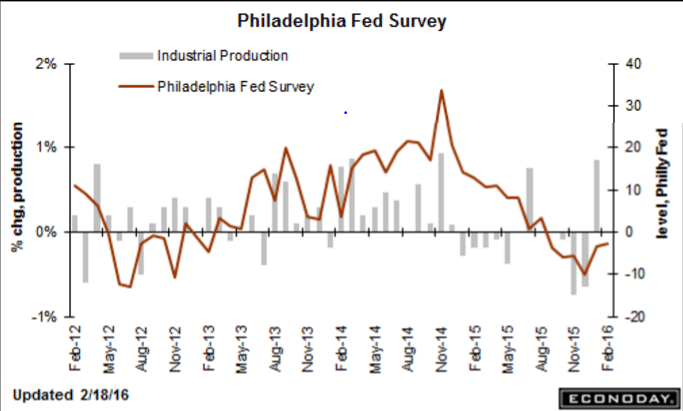
Another bad one, and supports the possibility of another downward revision to industrial production next month:
Philadelphia Fed Business Outlook Survey
Highlights
The Philly Fed report, much like Tuesday’s Empire State report, is pointing to continuing trouble for the nation’s factory sector. The general business conditions index came in at minus 2.8 to extend a long run of negative readings. New orders, at minus 5.3, have also been stuck in the minus column as have unfilled orders, at minus 12.7. Shipments, at plus 2.5, are positive for a second straight month but aren’t likely to hold above zero for very long given the weakness in orders. Employment is in the contraction column for a second straight month at minus 5.0 with the workweek also posting a second month of contraction at minus 12.9. Manufacturers in the region continue to draw down inventories, to indicate sagging expectations, with the 6-month outlook down nearly 2 points to 17.3 which is still in the plus column but very low for this reading. Price data continue hold in the negative column. This report is a disappointment and belies yesterday’s manufacturing strength in the industrial production report.

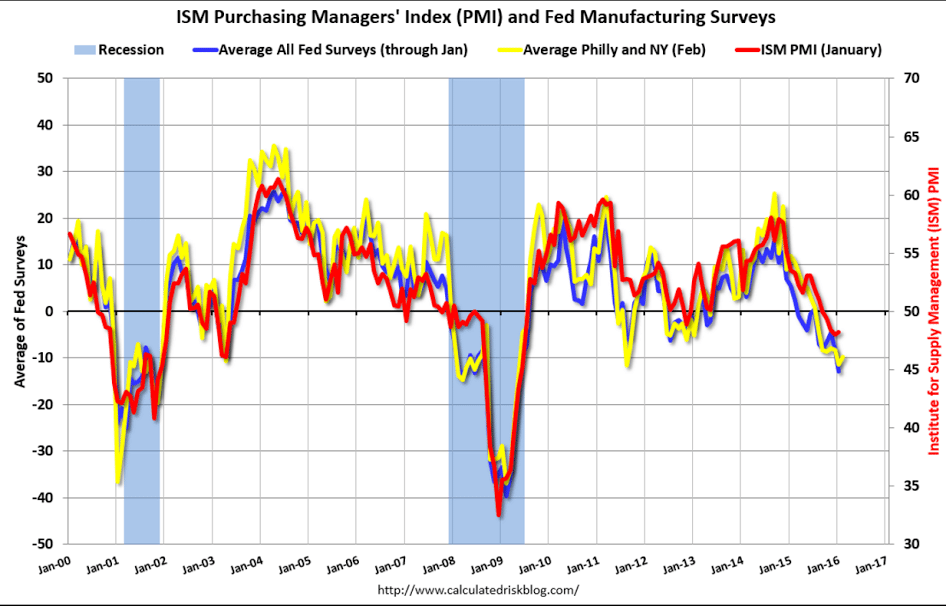
Hard to imagine from this chart that the US isn’t already in recession:

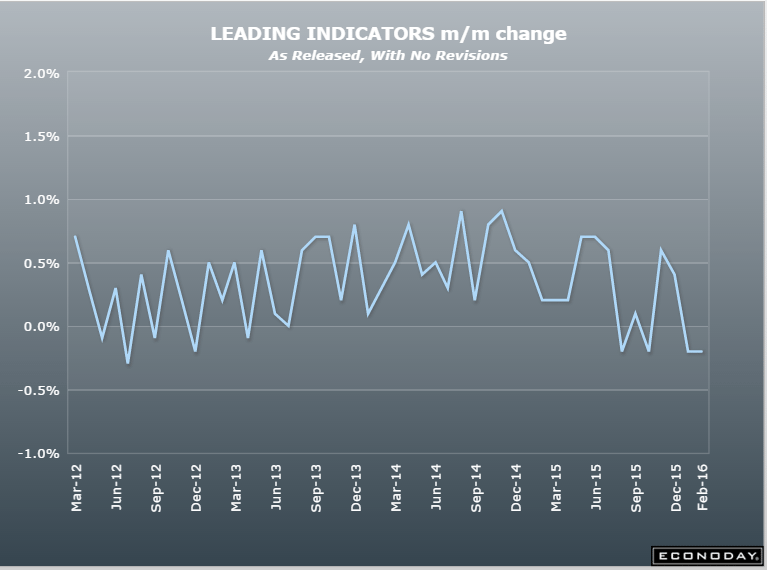
This series is biased towards positive numbers as it presumes a positive yield curve supports future growth, and with rates near 0 the yield curve is pretty much always going to be positive. So when it goes negative like this, it means the rest is that much more negative:
Leading Indicators


My point here remains that you can have no new claims AND no new hiring. And in any case states have made it more difficult to collect benefits, which are both low and fully taxable, so this could be the type of recession where hiring continues to decelerate and attrition continues without an increase in involuntary separations followed by filing for benefits:
Jobless Claims


