Highlights
Factory orders, like much of the economy, fizzled in March, up only 0.2 percent and skewed higher for a third month in a row by aircraft. The split between the report’s two main components shows a 0.5 percent dip for nondurable goods — the new data in today’s report where weakness is tied to petroleum and coal — and a 0.9 percent rise for durable orders which is 2 tenths higher than last week’s advance report for this component.
The gain for durables looks impressive but when excluding transportation equipment (which is where aircraft is tracked) orders fell 0.3 percent. But core capital goods orders are a plus in the report, rising 0.5 percent (nondefense ex-aircraft) though the gain follows marginal increases of 0.1 and 0.2 percent in the prior two months.
Unfilled factory orders, which had been in long contraction, are a clear plus, up 0.3 percent following February’s 0.1 percent gain for the best back-to-back showing in 2-1/2 years. A negative however is a 0.1 percent decline in total shipments that came despite a constructive 0.5 percent rise in shipments of core capital goods. Inventories were unchanged in the month though the dip in shipments drove the inventory-to-shipments ratio 1 tenth higher to a less lean 1.32.
Aircraft had a weak year last year and have been making up lost ground so far this year. But how long Boeing can give total orders a lift is uncertain, and the performance of the wider factory sector, despite sky high strength in many anecdotal reports, has been no better than mixed.
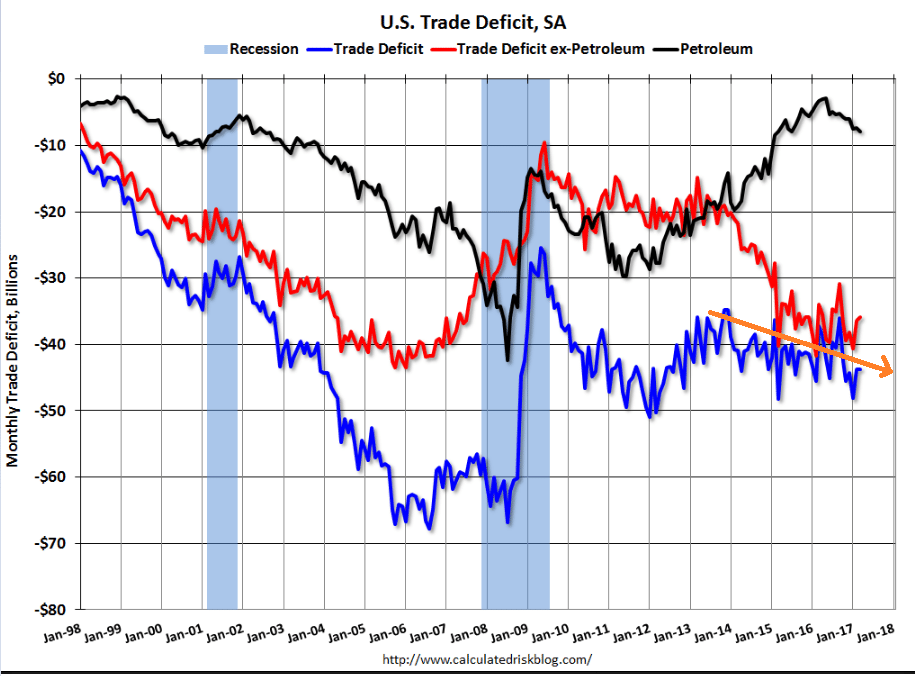
Both imports and exports down which isn’t a good sign for GDP, as the trade deficit seems to be slowly working its way higher. Also, there was more evidence that the reported positive spike in nonresidential investment for Q1 is suspect:

Highlights
A decline in imports held down March’s international trade gap to $43.7 billion which is moderately under Econoday’s consensus for $44.5 billion. But the breakdown doesn’t point to cross-border strength as exports fell 0.9 percent to $191.0 billion in the month against a 0.7 percent decline for imports at $234.7 billion.
The petroleum gap widened sharply in the month to a nearly 2-year high of $7.9 billion and reflects higher prices for imports and a decline in exports. Exports showing the most weakness are industrial supplies, autos, and consumer goods. Foods rose slightly in March as did the key category of capital goods which otherwise has been flat.
On the import side most components are lower especially capital goods in what, along with capital goods shipments and nonresidential construction spending, is another contrast with the first-quarter GDP surge in nonresidential investment. Contrasting with the weakness in imports is a rise in imports of autos, up a sharp $1.2 billion in the month to $30.3 billion.
Country data are in line with trend: the nation’s trade gap with China totaled $24.6 billion in the month followed by the EU at $11.2 billion with Japan at $7.2 billion and Mexico at $7.0 billion. Canada is next at a distant gap of $1.4 billion.
Breaking down the data between goods and services shows a small widening in the goods deficit to $65.5 billion offset in part by a modest looking but still constructive $0.4 billion dollar rise in the surplus on services. The overall decline in exports and imports is a concern, but today’s report has several positives, not only the surplus on services but also the rise in capital goods exports. Today’s report should give a modest and badly needed lift to revision estimates for first-quarter GDP.


Highlights
Chain stores are reporting mostly stronger rates of year-on-year sales growth for April, a month however that got a big boost from this year’s Easter shift out of March. Sales reports from chains are in year-on-year terms only and are not adjusted for calendar effects such as the shift in Easter which is a major holiday for the retail sector. The best way to look at chain-store sales during Easter shifts is to take both March and April together and with this comparison, stores are mostly downbeat. Weakness in consumer spending has been the dominant feature so far of the 2017 economy.
