Down a touch but the 4 week moving average still moving higher:
Highlights
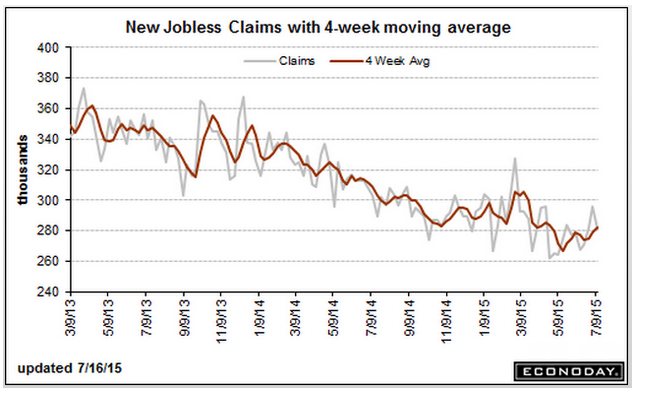
Auto retooling is clouding initial jobless claims data which fell 15,000 in the July 11 week to 281,000. But the 4-week average, inflated by a 14,000 spike in the prior week, rose 3,250 to a 282,500 level that’s more than 5,000 above the month ago comparison. The rise in the average is not a positive indication for the July employment report.
But the latest on continuing claims, which are reported with a 1-week lag, are very favorable, down a very steep 112,000 to 2.215 million in the July 4 week which is a new recovery low. Nevertheless, the 4-week average, down 3,000 to 2.264 million, is trending slightly higher than the month-ago comparison. The unemployment rate for insured workers is down 1 tenth to a recovery low of 1.6 percent.
July, with its closings in the auto sector, is always a difficult month for claims data. Next week’s report will be especially important as initial claims will cover the sample week for the monthly employment report.
Not at all good:
Highlights
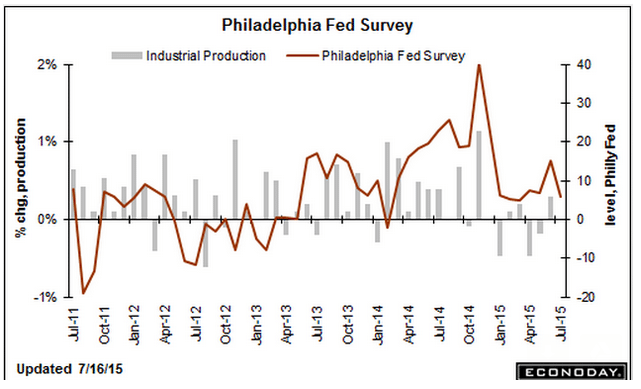
It turns out that the Philly Fed’s big jump in June was in fact a one-time wonder as the index slowed substantially in the July reading to 5.7 from 15.2. Growth in new orders is still respectable, at 7.1, but well down from June’s 15.2. Likewise, shipments slowed to 4.4 from 14.3 while backlog orders fell into contraction at minus 6.3 from plus 3.7. Employment also fell into contraction, at minus 0.4 from 3.8.
The June reading for this report stood alone as really the only strong indication this year on the manufacturing sector, but the give back now in July puts the Philly Fed in line with other readings. The nation’s manufacturing sector is being held down by weak exports and is a drag on economic growth.
Housing still a bit of a bright spot, relatively speaking, but still very low and depressed, and too small to move the GDP needle. And there are fewer builders:
Highlights
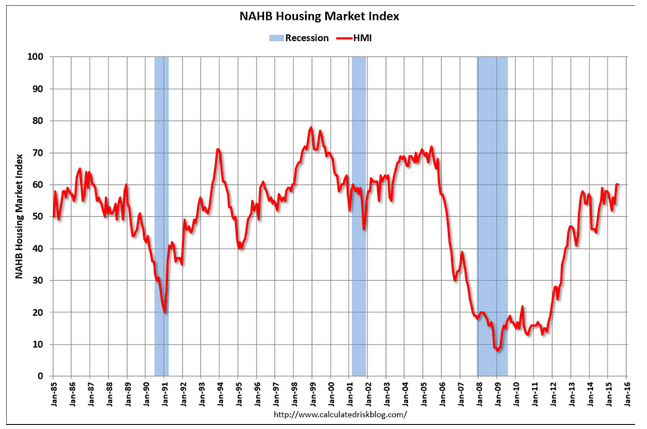
The housing market index, unchanged in July at 60, is signaling substantial strength for the new home market. This is the strongest reading since November 2005.
Future sales, at 71, lead the report with present sales right behind at 66. Still lagging is traffic, down 1 point in the month to 43 and reflecting a lack of first-time buyers in the market.
All regions are showing growth led by the West at a composite 63 followed by the South at 62. The Midwest is at 59 and the Northeast, which had been under 50 for a long run, is now at 52.
The new home market is accelerating and is in place to be the best surprise of the 2015 economy. Housing starts & permit data, which have been volatile but very strong, will be posted tomorrow.


