Some 5 years ago when the talk was about whether the US recovery was going to be V shaped or U shaped, I suggested that it would be more L shaped, as a 0 rate policy requires a larger deficit, etc. That is, after a sharp fall it would go sideways.
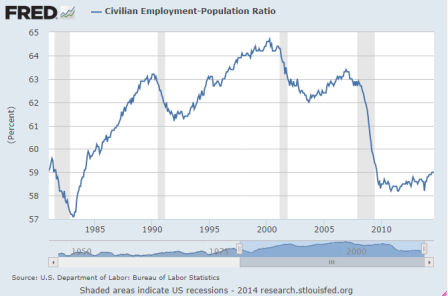
Here are a few illustrative charts:
![](https://moslereconomics.com/wp-content/graphs/2014/09/l-shape-1.png)
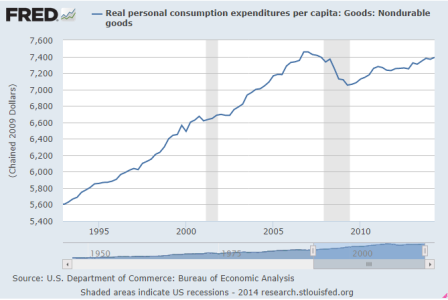
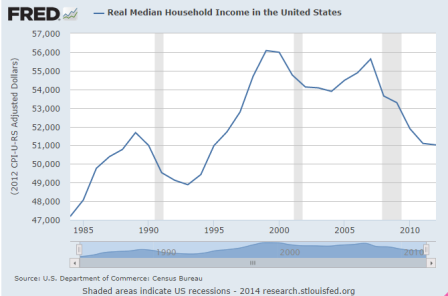
Adjusting this next one for population growth makes the point even more:
![](https://moslereconomics.com/wp-content/graphs/2014/09/l-shape-2.png)
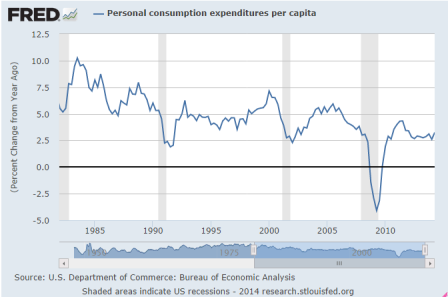
The growth rate of personal consumption has leveled off at over half of prior cycles:
![](https://moslereconomics.com/wp-content/graphs/2014/09/l-shape-3.png)
![](https://moslereconomics.com/wp-content/graphs/2014/09/l-shape-4.png)
![](https://moslereconomics.com/wp-content/graphs/2014/09/l-shape-5.png)
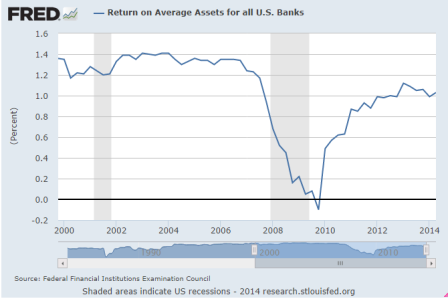
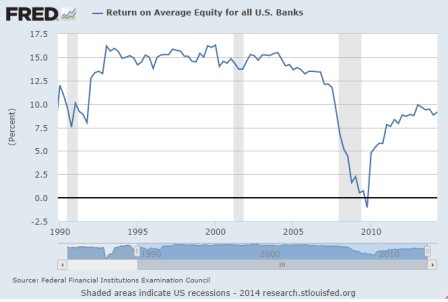
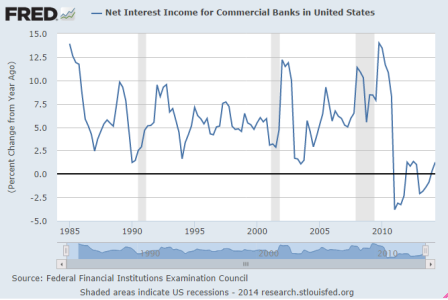
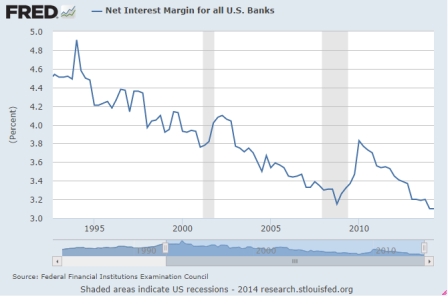
And looks like deep down ‘those demon banks’ haven’t fared all that well either:
![](https://moslereconomics.com/wp-content/graphs/2014/09/l-shape-6.png)
![](https://moslereconomics.com/wp-content/graphs/2014/09/l-shape-7.png)
![](https://moslereconomics.com/wp-content/graphs/2014/09/l-shape-8.png)
![](https://moslereconomics.com/wp-content/graphs/2014/09/l-shape-9.png)