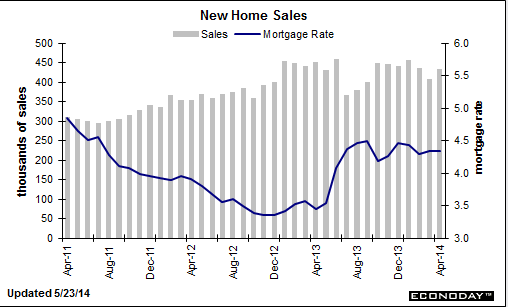
Another uninspiring chart, as sales dipped with the cold weather and only partially recovered, down vs same month last year, and, at best, looking very flat as we enter the ‘prime selling season’
Not to mention inventories are up and the composition of sales was towards condos, last I read:

Highlights
April did provide a spring lift to the housing sector at least compared to March, evident in yesterday’s report on existing home sales and especially evident in today’s 6.4 percent jump in new home sales to a higher-than-expected 433,000 annual rate. Also positive is an upward net revision of 11,000 to the two prior months.
A dip in prices contributed to April’s sales strength with the median price down 2.1 percent to $275,800. Year-on-year, the median price is at minus 1.3 percent for only the second negative reading since July 2012. Prices are now in line with sales where the year-on-year rate is minus 4.2 percent.
But, unlike the existing home sales report that shows a sudden swelling in supply, supply on the new home side remains scarce and will remain a negative for sales. Supply was hardly changed on the month, at 192,000 units for sale, while supply at the current sales rate fell to 5.3 months from March’s 5.6 months.
The new home market got an April bounce but against a very weak March. In context, April’s 433,000 is the second weakest rate of the last seven months. Still, the gain is welcome and should give a slight boost to the housing outlook. The Dow is holding at opening highs following today’s report.
Just landed Portland and still somewhat out of close touch.
My concerns remain that the too small federal deficit is keeping a lid on aggregate demand as the demand leakages continue, and the automatic fiscal stabilizers keep tightening the noose even with modest levels of growth.
It’s also possible the monthly employment numbers have been supported by the 1.2 million who lost benefits at year end taking ‘menial’ jobs, which would ‘front load’ jobs to the first several months of 2014, followed by lower than otherwise increases subsequently.
Early car sales forecasts are coming in just over 16 million, so that chart would continue it’s flattish appearance as well.
I’m thinking June numbers will show whether this economy can keep it’s head up with credit expansion sufficient to replace the reduction in govt deficit spending, or head south.

