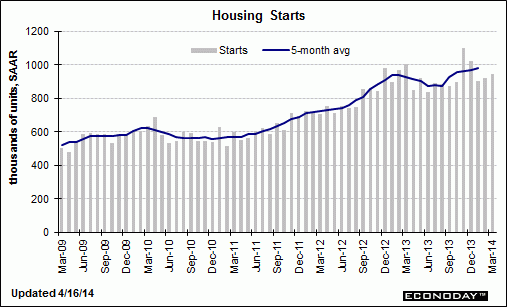
Another anemic ‘bounce’- down 5.9% from last year. And more reason to believe the much touted November/Dec ‘spike’ had something to with expiring tax credits. And with mtg purchase applications still running almost 20% lower year over year the housing contribution to GDP in general is so far looking lower than last year.
Housing Starts
Highlights
Housing starts picked up in March but not as much as expected. However, strength was in the single-family component while it was expected to be in the multifamily component. So, the expectations shortage really is not bad. Overall starts rose 2.8 percent after a 1.9 percent increase in February. The March annualized pace of 946,000 fell short of analysts’ forecast for 965,000 and was down 5.9 percent on a year-ago basis.
Single-family starts jumped 6.0 percent, following a 2.9 percent rise the month before. Multifamily starts slipped 3.1 percent in March after no change the month before.
Overall permits dipped 2.4 percent in March after surging 7.3 percent the prior month. The annualized rate of 990,000 was up 11.2 percent on a year-ago basis. The median market forecast was for 1.010 million. The softness came from the multifamily component which declined 6.4 percent after a 22.8 percent spike in February. The single-family component rebounded 0.5 percent, following a 1.7 percent dip in February.
Overall, the headline number was below expectations but the fact that moderate strength was in the single-family component is encouraging. Last month’s data in permits suggested more strength in the multifamily component. But the multifamily component is volatile and based on recent permits, there still is strength in that component. The gain in the single-family component is a bonus.

Somewhat volatile but over time just chugs along at a steady pace.
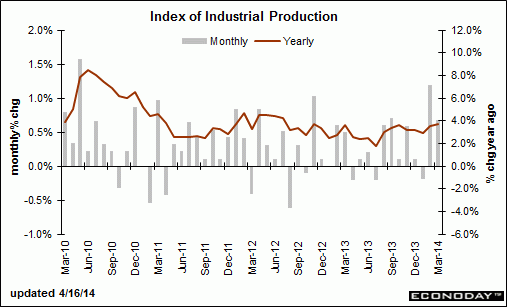
It’s generally the rest of gdp that’s does the moving and shaking:


