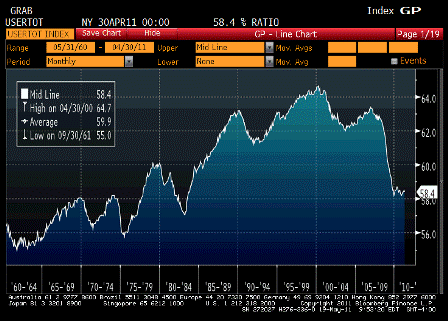
Typical street review of today’s numbers from Goldman.
As suspected, look for continued downward revisions to initial 4% Q2 estimates.
And note the graph below showing employment as a % of the population.
The economy continues to be demand constrained at very low levels.
(That is, for the size govt we have, we are grossly over taxed.)
There could be as many as 30 million additional people gainfully employed in a good economy.
And a general prosperity far beyond what anyone might imagine.
But not to be with Congress, mistakenly fearful of the US facing a financial crisis like Greece,
moving forward with their death by 1000 cuts agenda.
USA: Philadelphia Fed Survey – Another Decline
Actual: 3.9
Previous: 18.5
Consensus: 20.0
Released: 19 May 2011 at 10:00 (New York time)
Another Decline
BOTTOM LINE: More signs of slower growth from the Philly Fed index and existing home sales.
US-MAP
Existing home sales -2 (2, -1)
Philadelphia Fed index -12 (4, -3)
KEY NUMBERS:
Existing home sales -0.8% in Apr (mom) vs. GS +2.0%, median forecast +2.0%.
Philadelphia Fed index +3.9 in May vs. GS +22.0, median forecast +20.0.
Leading indicators -0.3% in Apr (mom) vs. median forecast +0.1%.
MAIN POINTS:
1. The Philadelphia Fed’s monthly manufacturing survey weakened sharply for the second month in a row. The headline index of “general business activity” fell to 3.9, from 18.5 in April and 43.4 in March. This still suggests factory sector growth, but only barely. Most of the detailed activity indexes also weakened – the new orders index fell to 5.4 from 18.8, the shipments index to 6.5 from 29.1, and the unfilled orders index to -7.8 from 12.9 – with the exception of employment, which rose to 22.1 from 12.3 in April. (We have no information on how much of the drop in the Philly survey over the past two months could have been related to supply chain issues associated with the Japanese earthquake, but this is not a region with an especially high concentration of vehicle manufacturing.) Price pressures eased a little but remain high in historical terms.
2. Existing home sales declined by 0.8% mom in April to an annualized rate of 5.05 million units. Consensus forecasts had expected a moderate increase. Home sales dropped in three of the four Census regions during the month, with the largest declines in the Northeast. The number of homes currently offered for sales was about unchanged after seasonal adjustment, at about 3.7 million units (the months supply of homes increased, but this was likely due to seasonal variation). The median sales price of existing homes increased by about 0.5% mom on a seasonally-adjusted basis-an encouraging turn after several months of weakness. Existing home sales prices are down 5% year-over-year.
3. Rounding out the weaker-than-expected data, the index of leading economic indicators fell by 0.3% mom in April. The consensus had expected a 0.1% increase.


