Mosler Economics / Modern Monetary Theory

The Site of Economist Warren Mosler

Mosler Economics / Modern Monetary Theory

Main menu

Skip to primary content
  • Home
  • About
  • Mandatory Readings
  • MMT White Paper
  • Policy Proposals
  • Media
  • Q&A
  • Support
  • Contact

Post navigation

← Previous Next →

Valance chart

Posted on June 29, 2009 @ 12:38 pm (Monday) by WARREN MOSLER


[Skip to the end]

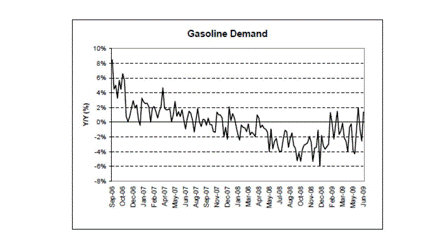
Gasoline demand sort of flat year over year.

And GDP growth still negative, though less so now.

Doesn’t look like there was an serious ‘demand destruction?’

[top]

Share
This entry was posted in Commodities and tagged gasoline consumption, graph, picture by WARREN MOSLER. Bookmark the permalink.
Proudly powered by WordPress