- Producer Price Index MoM (Released 8:30 EST)
- PPI Ex Food and Energy MoM (Released 8:30 EST)
- Producer Price Index YoY (Released 8:30 EST)
- PPI Ex Food and Energy YoY (Released 8:30 EST)
- Initial Jobless Claims (Released 8:30 EST)
- Continuing Claims (Released 8:30 EST)
- Jobless Claims ALLX (Released 8:30 EST)
- Leading Indicators (Released 10:00 EST)
- Leading Indicators ALLX (Released 10:00 EST)
- Philadelphia Fed (Released 10:00 EST)
- Philadelphia Fed TABLE 1 (Released 10:00 EST)
- Philadelphia Fed TABLE 2 (Released 10:00 EST)
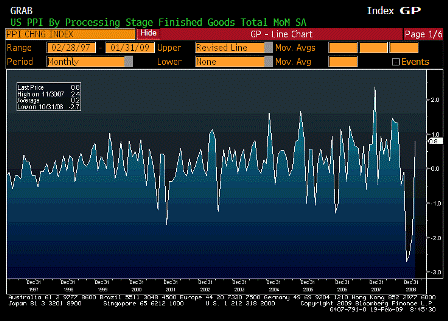
Producer Price Index MoM (Jan)
| Survey | 0.3% |
| Actual | 0.8% |
| Prior | -1.9% |
| Revised | n/a |
Karim writes:
- PPI up 0.8% and 0.4% core; core boosted by some annual one-offs (prescriptions at 1.1% and tobacco at 0.6%)
- Pipeline pressures continue to decline; intermediate -0.7% and core intermediate -1.1%; crude -2.9% and core crude 0.1%
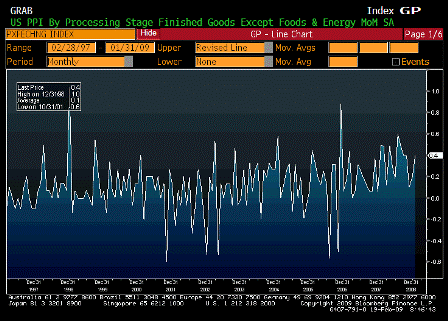
PPI Ex Food and Energy MoM (Jan)
| Survey | 0.1% |
| Actual | 0.4% |
| Prior | 0.2% |
| Revised | n/a |
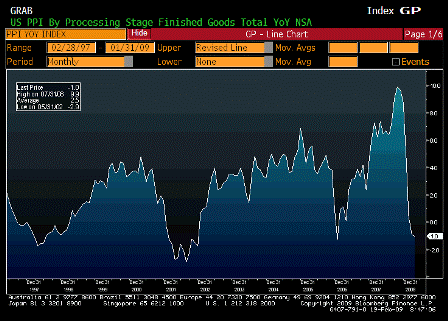
Producer Price Index YoY (Jan)
| Survey | -2.4% |
| Actual | -1.0% |
| Prior | -0.9% |
| Revised | n/a |
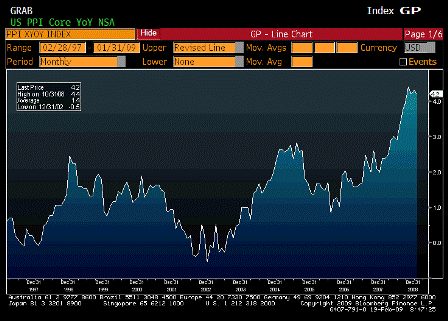
PPI Ex Food and Energy YoY (Jan)
| Survey | 3.8% |
| Actual | 4.2% |
| Prior | 4.3% |
| Revised | n/a |
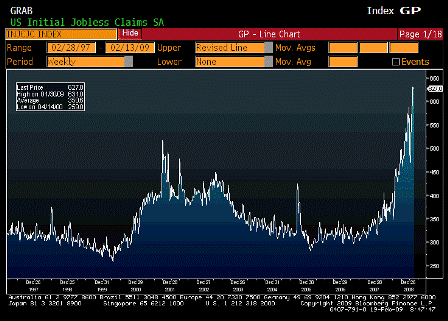
Initial Jobless Claims (Feb 14)
| Survey | 620K |
| Actual | 627K |
| Prior | 623K |
| Revised | 627K |
Karim writes:
- Initial claims remain unch at 627k (prior week revised up 4k)
- Continuing claims up 170k to new cycle high
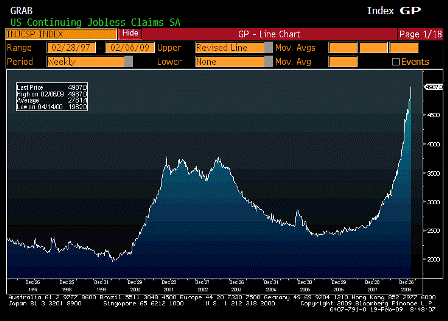
Continuing Claims (Feb 7)
| Survey | 4830K |
| Actual | 4987K |
| Prior | 4810K |
| Revised | 4817K |
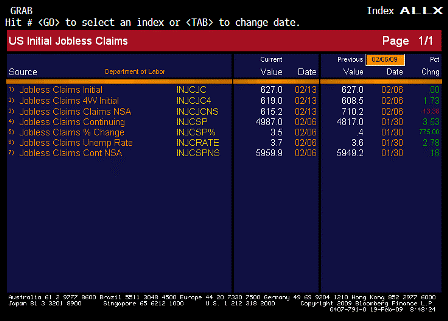
Jobless Claims ALLX (Feb 14)
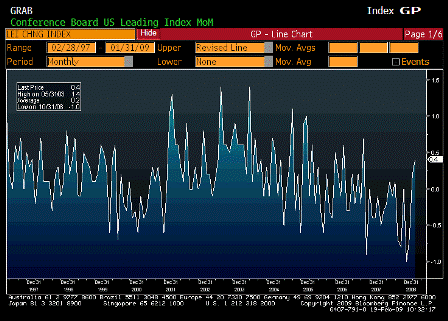
Leading Indicators (Jan)
| Survey | 0.1% |
| Actual | 0.4% |
| Prior | 0.3% |
| Revised | 0.2% |
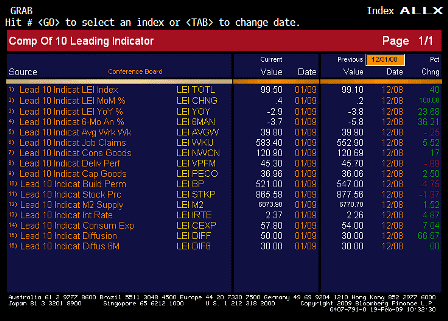
Leading Indicators ALLX (Jan)
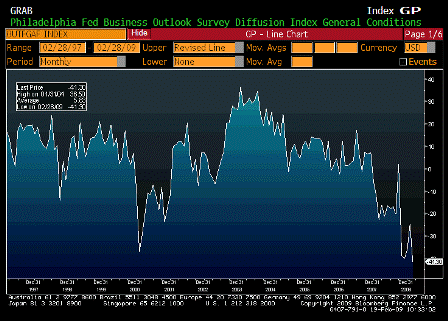
Philadelphia Fed (Feb)
| Survey | -25.0 |
| Actual | -41.3 |
| Prior | -24.3 |
| Revised | n/a |
Karim writes:
- Philly Fed confirms Empire survey earlier this week that rate of decline in manufacturing is accelerating.
- Headline activity, orders, shipments, and employment all fall sharply
| Feb 2009 | Jan 2009 | Dec 2008 | Nov 2008 | Oct 2008 | Sept 2008 | Aug 2008 | 6 month avg | |
| General Business Activity | -41.3 | -24.3 | -36.1 | -39.8 | -38.7 | 1.9 | -20.1 | -29.7 |
| Prices Paid | -13.7 | -27.0 | -25.5 | -26.6 | 10.2 | 32.5 | 53.0 | -8.4 |
| Prices Received | -27.8 | -26.2 | -32.8 | -11.3 | 5.0 | 15.1 | 25.1 | -13.0 |
| New Orders | -30.3 | -22.3 | -28.2 | -29.3 | -30.6 | 3.8 | -15.2 | -22.8 |
| Shipments | -32.4 | -16.7 | -29.7 | -19.3 | -17.6 | -1.3 | -6.1 | -19.5 |
| # of Employees | -45.8 | -39.0 | -28.6 | -23.8 | -19.2 | -3.2 | -4.6 | -26.6 |
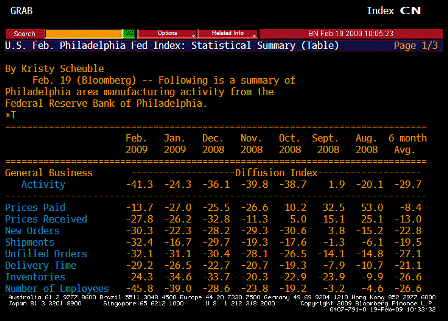
Philadelphia Fed TABLE 1 (Feb)
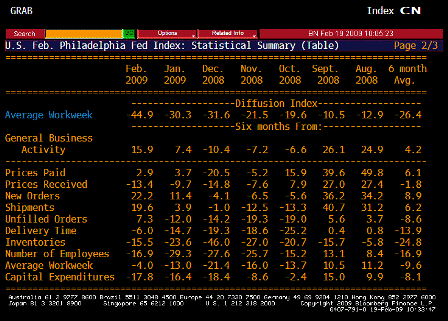
Philadelphia Fed TABLE 2 (Feb)
[top]


