- Consumer Price Index MoM (Released 8:30 EST)
- CPI Ex Food and Energy MoM (Released 8:30 EST)
- Consumer Price Index YoY (Released 8:30 EST)
- CPI Ex Food and Energy YoY (Released 8:30 EST)
- CPI Core Index SA (Released 8:30 EST)
- Consumer Price Index NSA (Released 8:30 EST)
- Consumer Price Index TABLE 1 (Released 8:30 EST)
- Consumer Price Index TABLE 2 (Released 8:30 EST)
- Consumer Price Index TABLE 3 (Released 8:30 EST)
- Net Long Term TIC Flows (Released 9:00 EST)
- Total Net TIC Flows (Released 9:00 EST)
- Industrial Production MoM (Released 9:15 EST)
- Industrial Production YoY (Released 9:15 EST)
- Capacity Utilization (Released 9:15 EST)
- Capacity Utilization TABLE 1 (Released 9:15 EST)
- Capacity Utilization TABLE 2 (Released 9:15 EST)
- Capacity Utilization TABLE 3 (Released 9:15 EST)
- U of Michigan Confidence (Released 10:00 EST)
- U of Michigan TABLE Inflation Expectations (Released 10:00 EST)
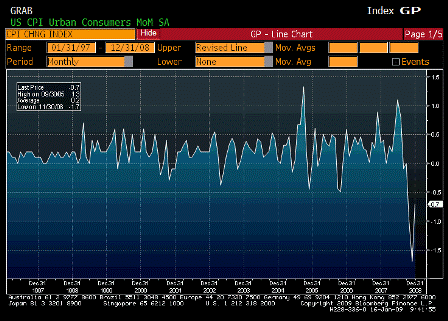
Consumer Price Index MoM (Dec)
| Survey | -0.9% |
| Actual | -0.7% |
| Prior | -1.7% |
| Revised | n/a |
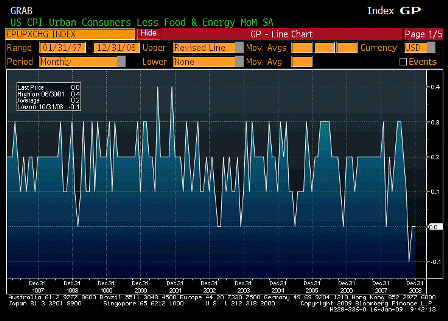
CPI Ex Food and Energy MoM (Dec)
| Survey | 0.1% |
| Actual | 0.0% |
| Prior | 0.0% |
| Revised | n/a |
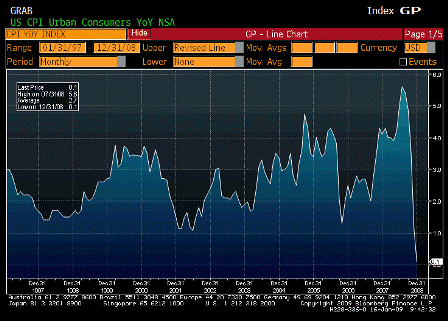
Consumer Price Index YoY (Dec)
| Survey | -0.2% |
| Actual | 0.1% |
| Prior | 1.1% |
| Revised | n/a |
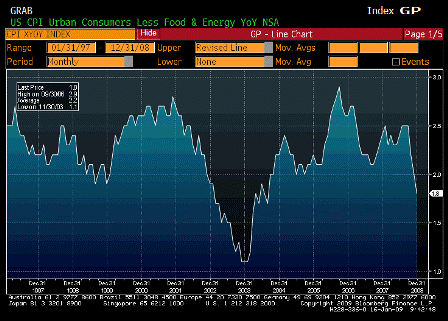
CPI Ex Food and Energy YoY (Dec)
| Survey | 1.8% |
| Actual | 1.8% |
| Prior | 2.0% |
| Revised | n/a |
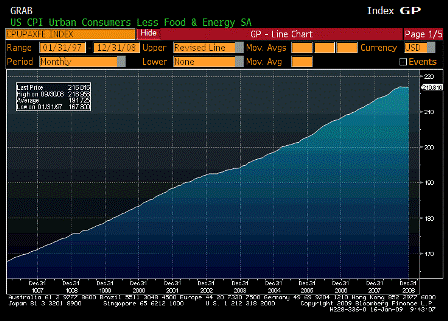
CPI Core Index SA (Dec)
| Survey | n/a |
| Actual | 216.816 |
| Prior | 216.849 |
| Revised | n/a |
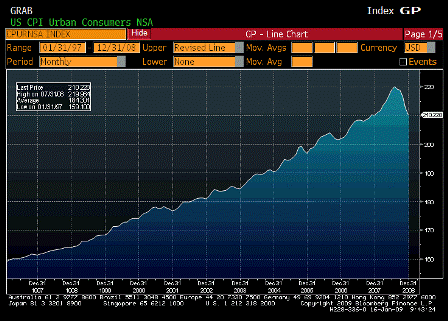
Consumer Price Index NSA (Dec)
| Survey | 210.210 |
| Actual | 210.228 |
| Prior | 212.425 |
| Revised | n/a |
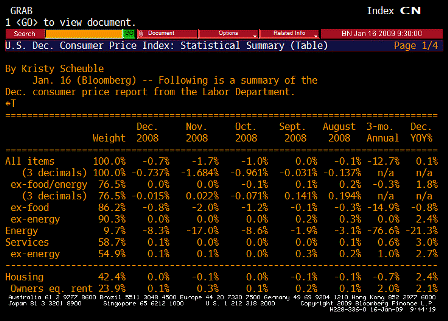
Consumer Price Index TABLE 1 (Dec)
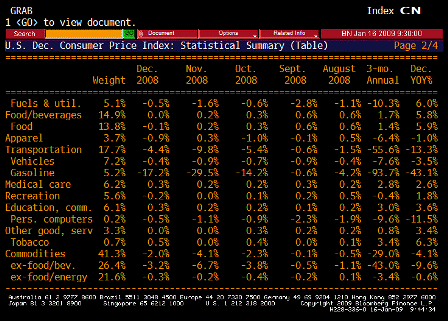
Consumer Price Index TABLE 2 (Dec)
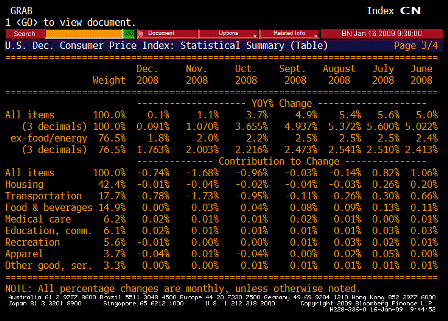
Consumer Price Index TABLE 3 (Dec)
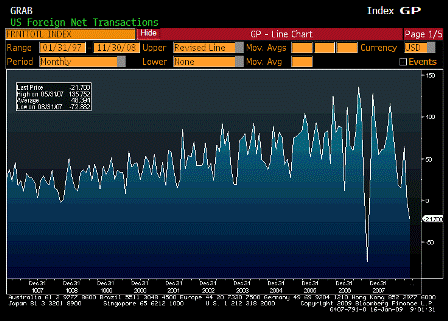
Net Long Term TIC Flows (Nov)
| Survey | $15.0B |
| Actual | -$21.7B |
| Prior | $1.5B |
| Revised | -$0.4B |
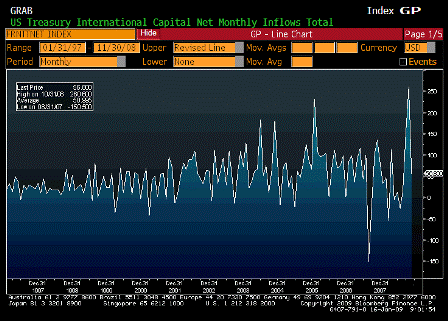
Total Net TIC Flows (Nov)
| Survey | n/a |
| Actual | $56.8B |
| Prior | $286.3B |
| Revised | $260.6B |
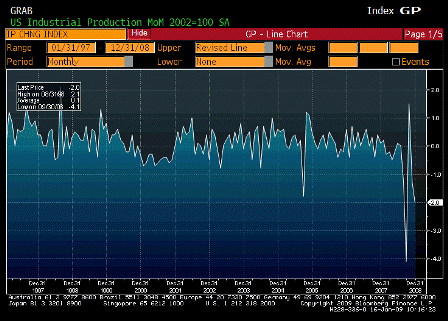
Industrial Production MoM (Dec)
| Survey | -1.0% |
| Actual | -2.0% |
| Prior | -0.6% |
| Revised | -1.3% |
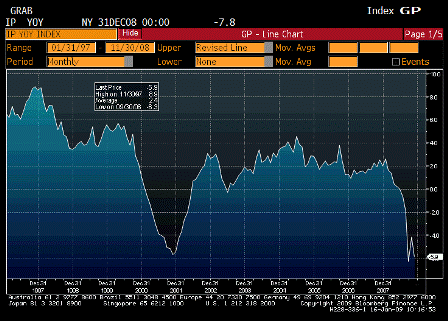
Industrial Production YoY (Dec)
| Survey | n/a |
| Actual | -5.5% |
| Prior | -4.5% |
| Revised | n/a |
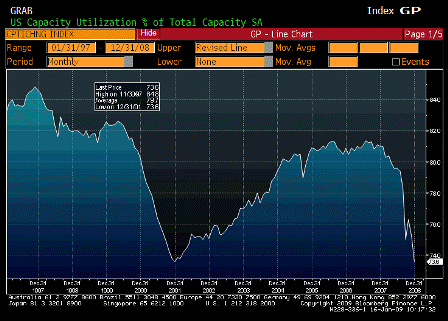
Capacity Utilization (Dec)
| Survey | 74.5% |
| Actual | 73.6% |
| Prior | 75.4% |
| Revised | 75.2% |
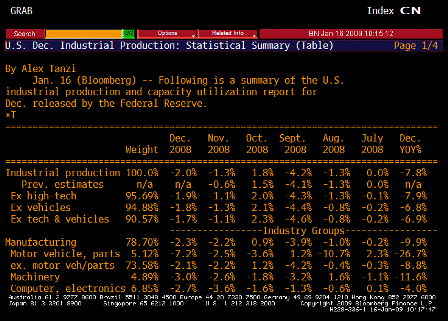
Capacity Utilization TABLE 1 (Dec)
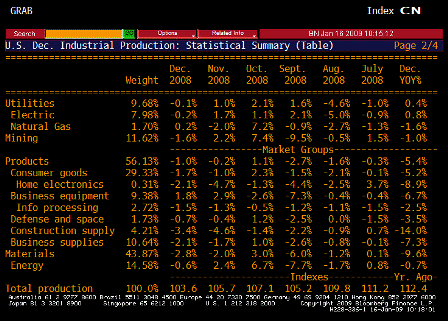
Capacity Utilization TABLE 2 (Dec)
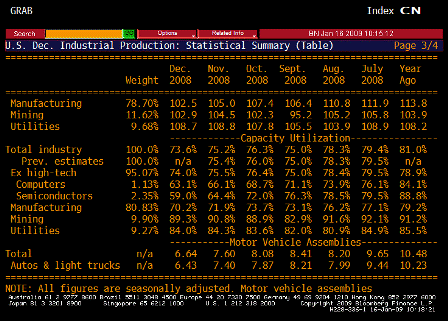
Capacity Utilization TABLE 3 (Dec)
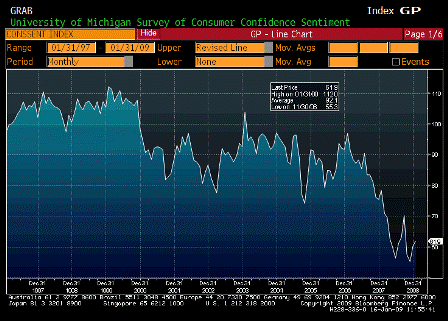
U of Michigan Confidence (Jan P)
| Survey | 59.0 |
| Actual | 61.9 |
| Prior | 60.1 |
| Revised | n/a |
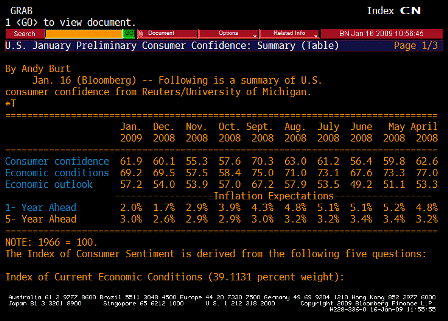
U of Michigan TABLE Inflation Expectations (Jan P )
[top]


