- Change in Nonfarm Payrolls (Released 8:30 EST)
- Change in Nonfarm Payrolls YoY (Released 8:30 EST)
- Nonfarm Payrolls ALLX (Released 8:30 EST)
- Unemployment Rate (Released 8:30 EST)
- Unemployment Rate ALLX 1 (Released 8:30 EST)
- Unemployment Rate ALLX 2 (Released 8:30 EST)
- Change in Manufacturing Payrolls (Released 8:30 EST)
- Change in Manufacturing Payrolls YoY (Released 8:30 EST)
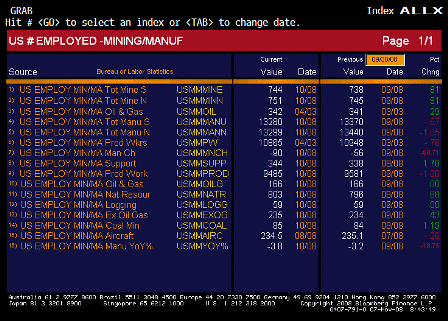
- Manufacturing Payrolls ALLX (Released 8;30 EST)
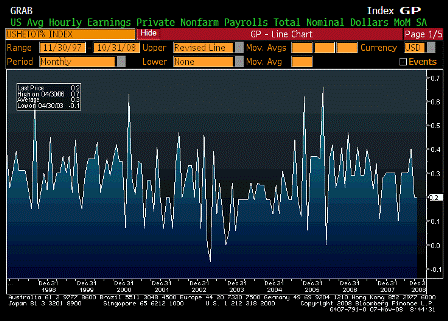
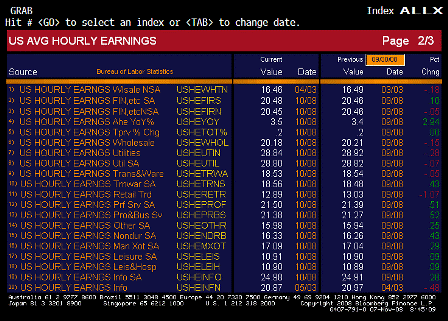
- Average Hourly Earnings MoM (Released 8:30 EST)
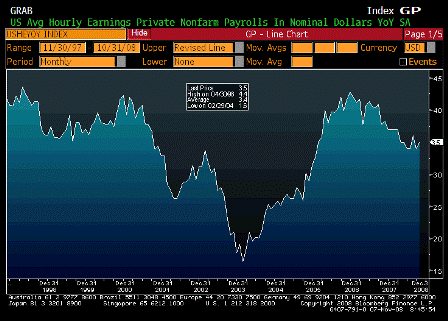
- Average Hourly Earnings YoY (Released 8:30 EST)
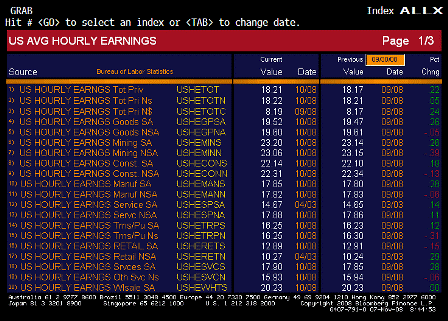
- Average Hourly Earnings ALLX 1 (Released 8:30 EST)
- Average Hourly Earnings ALLX 2 (Released 8:30 EST)
- Average Weekly Hours (Released 8:30 EST)
- Wholesale Inventories MoM (Released 10:00 EST)
- Wholesale Inventories YoY (Released 10:00 EST)
- Wholesale Inventories ALLX 1 (Released 10:00 EST)
- Wholesale Inventories ALLX 2 (Released 10:00 EST)
- Pending Home Sales (Released 11:30 EST)
- Pending Home Sales MoM (Released 11:30 EST)
- Pending Home Sales YoY (Released 11:30 EST)
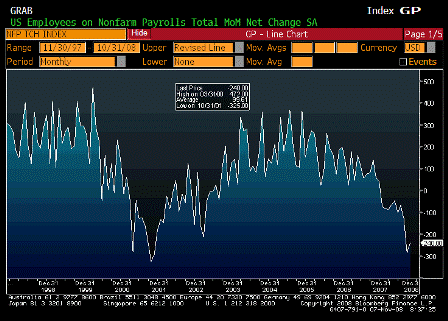
Change in Nonfarm Payrolls (Oct)
| Survey | -200K |
| Actual | -240K |
| Prior | -159K |
| Revised | -284K |
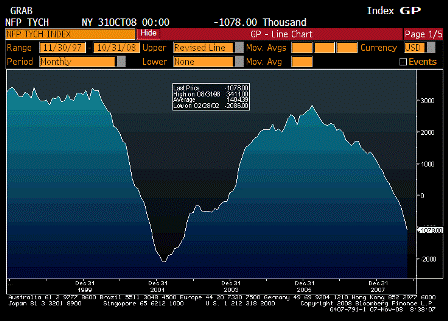
Change in Nonfarm Payrolls YoY (Oct)
| Survey | n/a |
| Actual | -1078.00 |
| Prior | -698.00 |
| Revised | n/a |
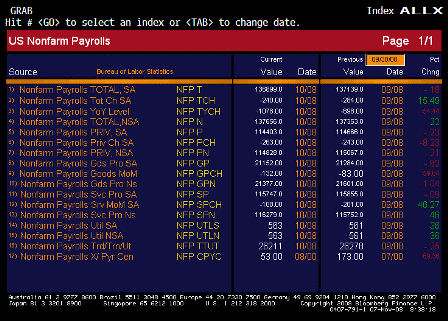
Nonfarm Payrolls ALLX (Oct)
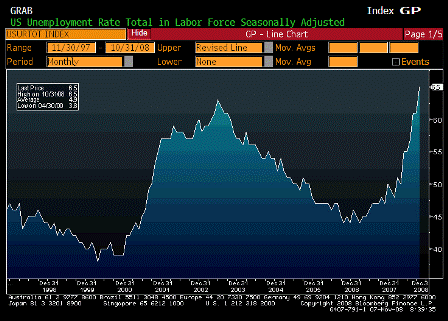
Unemployment Rate (Oct)
| Survey | 6.3% |
| Actual | 6.5% |
| Prior | 6.1% |
| Revised | n/a |
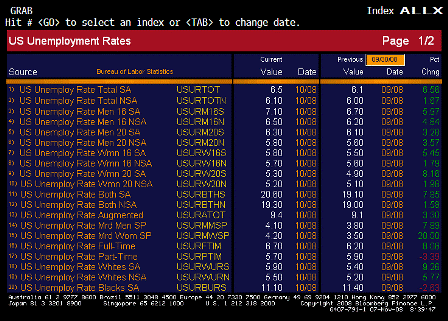
Unemployment Rate ALLX 1 (Oct)
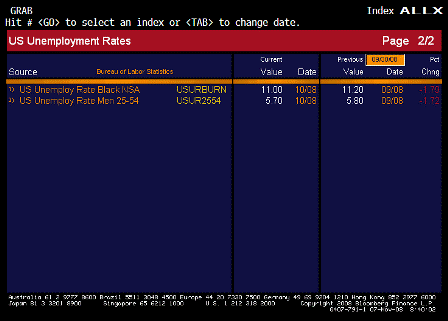
Unemployment Rate ALLX 2 (Oct)
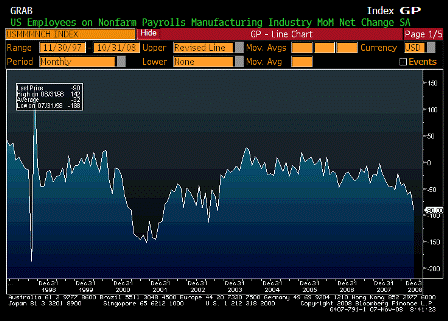
Change in Manufacturing Payrolls (Oct)
| Survey | -65K |
| Actual | -90K |
| Prior | -51K |
| Revised | -56K |
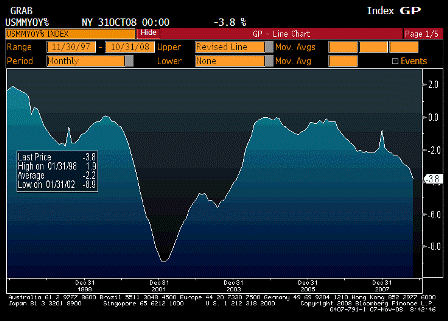
Change in Manufacturing Payrolls YoY (Oct)
| Survey | n/a |
| Actual | -3.8% |
| Prior | -3.2% |
| Revised | n/a |
Manufacturing Payrolls ALLX (Oct)
Karim writes:
Payrolls:
Worse than expected (but that was expected)
- -240k; unemployment rate rises from 6.1% to 6.5%
- Net revisions -179k (Sep revised from -159k to -284k)
- Hours continue to shrink -0.3% m/m and -2.6% annualized over past 3mths
- Avg hourly earnings 0.2%
- Avg duration of unemployment jumps from 18.4weeks to 19.7
- Diffusion index falls from 38.1 to 37.6
By industry:
- Mfg -90k
- Construction -49k
- Retail -38k
- Finance -24k
- Temp -34k
- Education 21k
- Govt 23k
Average Hourly Earnings MoM (Oct)
| Survey | 0.2% |
| Actual | 0.2% |
| Prior | 0.2% |
| Revised | n/a |
Average Hourly Earnings YoY (Oct)
| Survey | 3.5% |
| Actual | 3.5% |
| Prior | 3.4% |
| Revised | n/a |
Average Hourly Earnings ALLX 1 (Oct)
Average Hourly Earnings ALLX 2 (Oct)
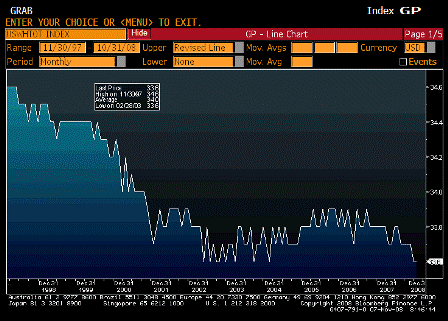
Average Weekly Hours (Oct)
| Survey | 33.6 |
| Actual | 33.6 |
| Prior | 33.6 |
| Revised | n/a |
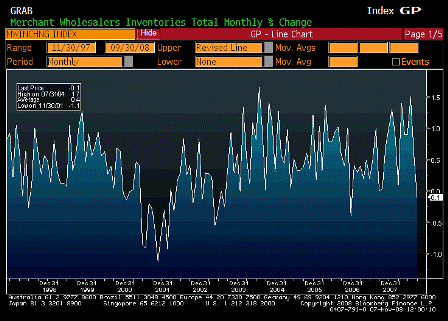
Wholesale Inventories MoM (Sep)
| Survey | 0.3% |
| Actual | -0.1% |
| Prior | 0.8% |
| Revised | 0.6% |
Falling?
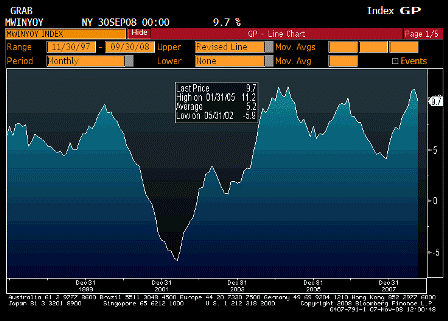
Wholesale Inventories YoY (Sep)
| Survey | n/a |
| Actual | 9.7% |
| Prior | 10.9% |
| Revised | n/a |
Past the peak?
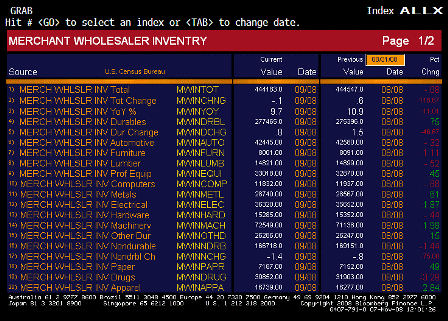
Wholesale Inventories ALLX 1 (Sep)
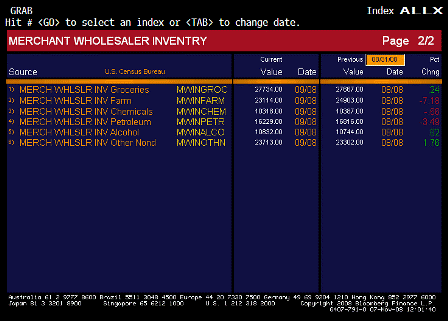
Wholesale Inventories ALLX 2 (Sep)
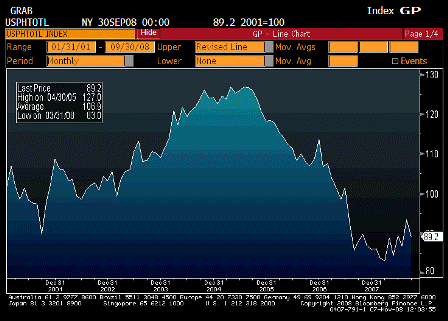
Pending Home Sales (Sep)
| Survey | n/a |
| Actual | 89.2 |
| Prior | 93.5 |
| Revised | n/a |
Still a mini trend higher.
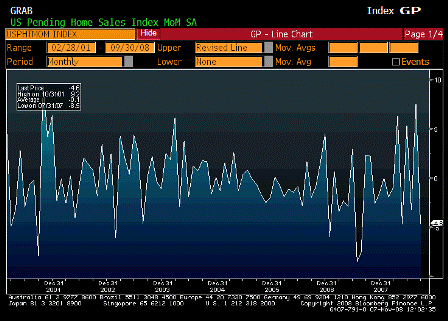
Pending Home Sales MoM (Sep)
| Survey | -3.4% |
| Actual | -4.6% |
| Prior | 7.4% |
| Revised | 7.5% |
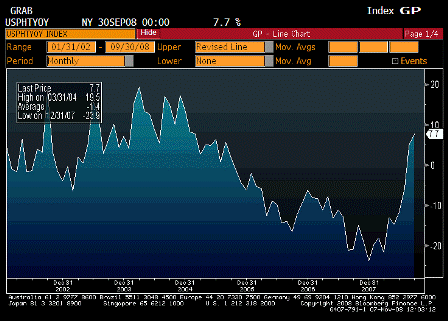
Pending Home Sales YoY (Sep)
| Survey | n/a |
| Actual | 7.7% |
| Prior | 5.1% |
| Revised | n/a |
Not bad! probably lots of foreclosure sales.
[top]


