- ICSC UBS Store Sales YoY (Released 7:45 EST)
- ICSC UBS Store Sales WoW (Released 7:45 EST)
- Redbook Store Sales Weekly YoY (Released 8:55 EST)
- Redbook Store Sales MoM (Released 8:55 EST)
- ICSC UBS Redbook Comparison TABLE (Released 8:55 EST)
- S&P CS Composite 20 YoY (Released 9:00 EST)
- S&P Case Shiller Home Price Index (Released 9:00 EST)
- S&P Case Shiller Home Price Index YoY (Released 9:00 EST)
- Case Shiller ALLX 1 (Released 9:00 EST)
- Case Shiller ALLX 2 (Released 9:00 EST)
- Consumer Confidence (Released 10:00 EST)
- Consumer Confidence ALLX 1 (Released 10:00 EST)
- Consumer Confidence ALLX 2 (Released 10:00 EST)
- Richmond Fed Manufacturing Index (Released 10:00 EST)
- Richmond Fed Manufacturing Index ALLX (Released 10:00 EST)
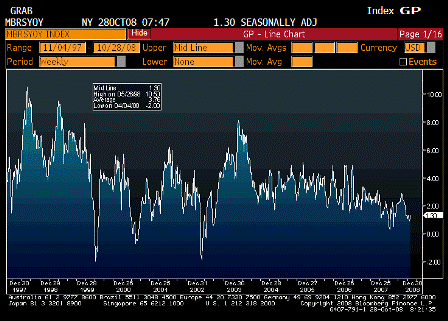
ICSC UBS Store Sales YoY (Oct 28)
| Survey | n/a |
| Actual | 1.30% |
| Prior | 0.90% |
| Revised | n/a |
Maybe rebounding some with lower gas prices?
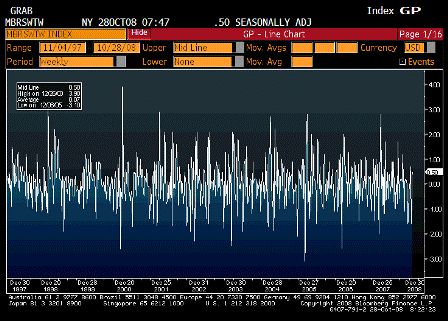
ICSC UBS Store Sales WoW (Oct. 28)
| Survey | n/a |
| Actual | 0.50% |
| Prior | -1.60% |
| Revised | n/a |
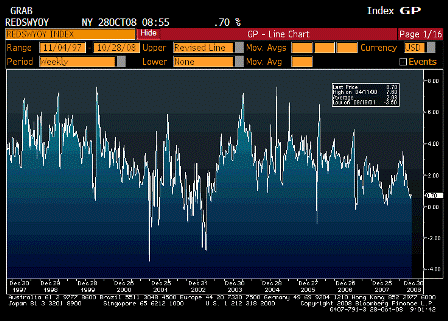
Redbook Store Sales Weekly YoY (Oct. 28)
| Survey | n/a |
| Actual | 0.70% |
| Prior | 0.80% |
| Revised | n/a |
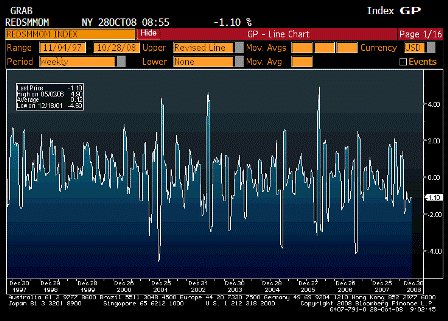
Redbook Store Sales MoM (Oct. 28)
| Survey | n/a |
| Actual | -1.10% |
| Prior | -1.10% |
| Revised | n/a |
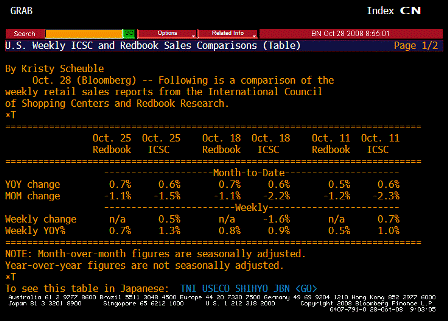
ICSC UBS Redbook Comparison TABLE (Oct. 28)
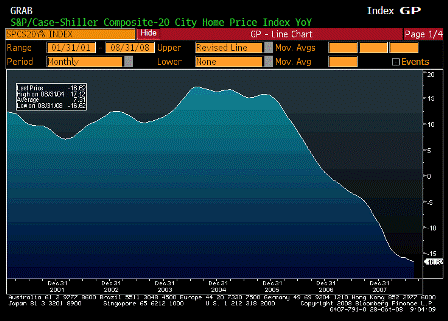
S&P CS Composite 20 YoY (Aug)
| Survey | -16.60% |
| Actual | -16.62% |
| Prior | -16.35% |
| Revised | -16.32% |
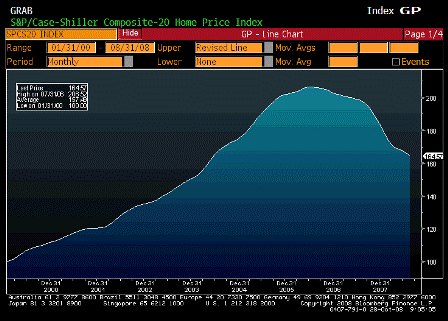
S&P Case Shiller Home Price Index (Aug)
| Survey | n/a |
| Actual | 164.57 |
| Prior | 166.23 |
| Revised | 166.29 |
Still falling but at a slower rate
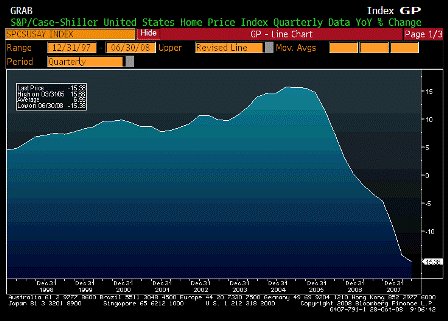
S&P Case Shiller Home Price Index YoY (Aug)
| Survey | n/a |
| Actual | -15.38% |
| Prior | -14.22% |
| Revised | n/a |
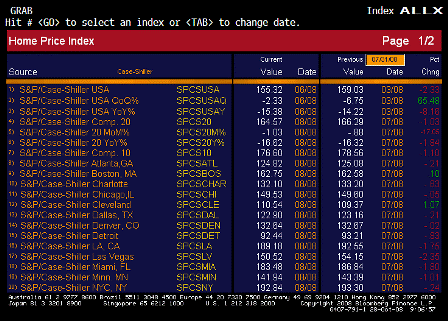
Case Shiller ALLX 1 (Aug)
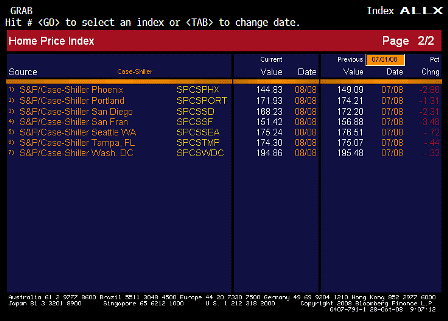
Case Shiller ALLX 2 (Aug)
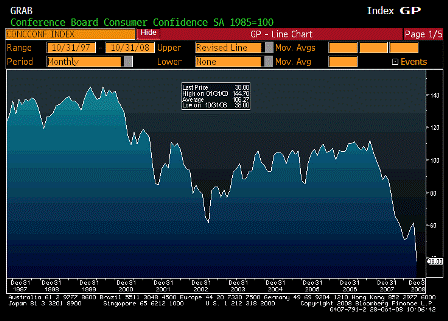
Consumer Confidence (Oct)
| Survey | 52.0 |
| Actual | 38.0 |
| Prior | 59.8 |
| Revised | 61.4 |
Major dip here.
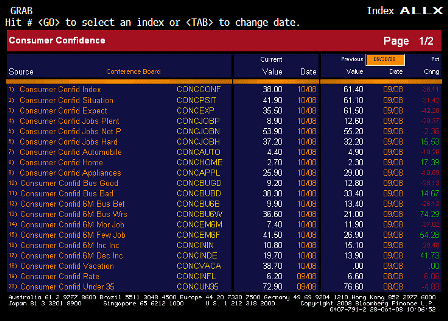
Consumer Confidence ALLX 1 (Oct)
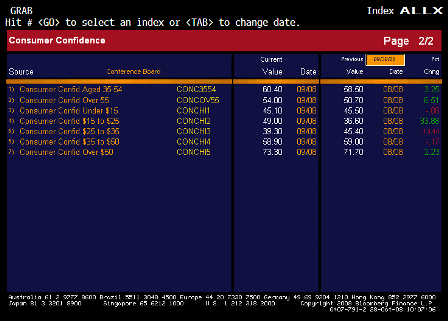
Consumer Confidence ALLX 2 (Oct)
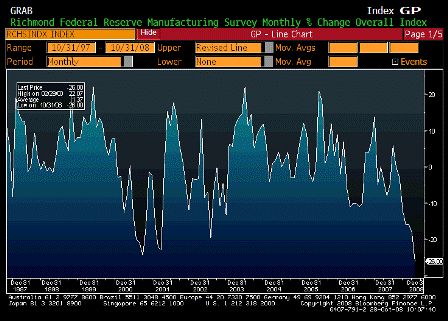
Richmond Fed Manufacturing Index (Oct)
| Survey | -23 |
| Actual | -26 |
| Prior | -18 |
| Revised | n/a |
Also bad.
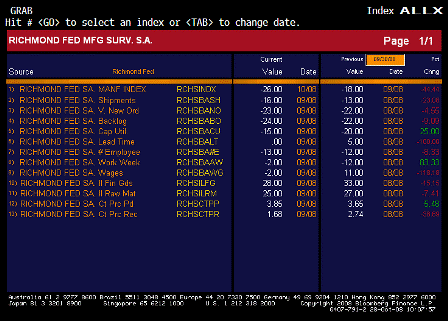
Richmond Fed Manufacturing Index ALLX (Oct)
[top]


