- Initial Jobless Claims (Released 8:30 EST)
- Continuing Jobless Claims (Released 8:30 EST)
- Jobless Claims TABLE 1 (Released 8:30 EST)
- Jobless Claims TABLE 2 (Released 8:30 EST)
- Philadelphia Fed (Released 10:00 EST)
- Philadelphia Fed TABLE 1 (Released 10:00 EST)
- Philadelphia Fed TABLE 2 (Released 10:00 EST)
- Leading Indicators (Released 10:00 EST)
- Leading Indicators ALLX (Released 10:00 EST)
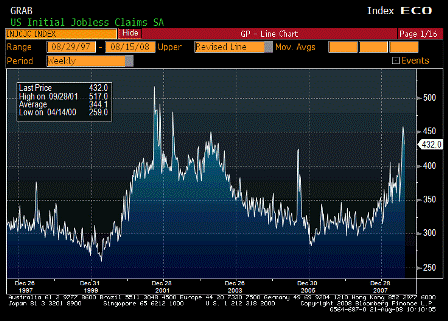
Initial Jobless Claims (Aug 16)
| Survey | 440K |
| Actual | 432K |
| Prior | 450K |
| Revised | 445K |
Still high, even though lower than expected and last week revised down some. It will take a while before the effect of the new extended benefit program is altering the numbers.
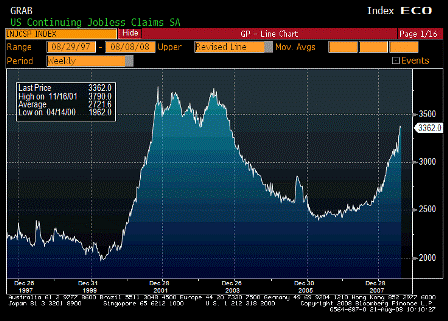
Continuing Jobless Claims (Aug 9)
| Survey | 3405K |
| Actual | 3362K |
| Prior | 3417K |
| Revised | 3379K |
Also lower than expected and last week revised down, But still high and not showing any meaningful signs of a top.
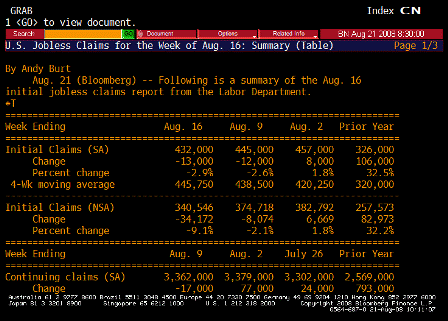
Jobless Claims TABLE 1 (Aug 16)
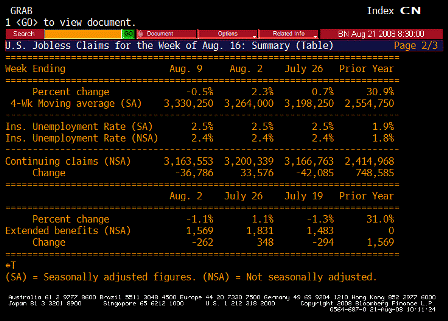
Jobless Claims TABLE 2 (Aug 16)
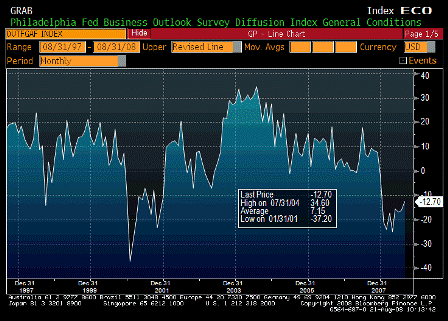
Philadelphia Fed (Aug)
| Survey | -12.6 |
| Actual | -12.7 |
| Prior | -16.3 |
| Revised | n/a |
Still negative, but the rate of contraction seems to be declining.
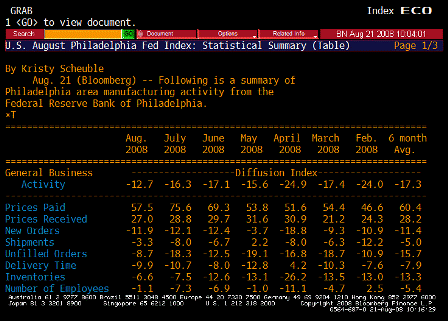
Philadelphia Fed TABLE 1 (Aug)
Prices paid down some, but still way high.
Employment improved to near flat.
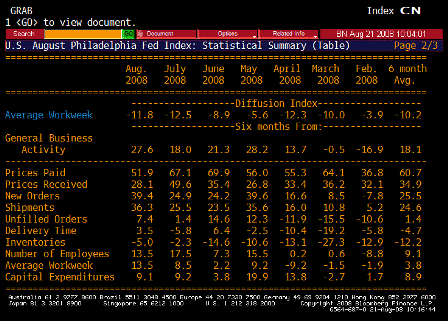
Philadelphia Fed TABLE 2 (Aug)
Workweek creeping up some.
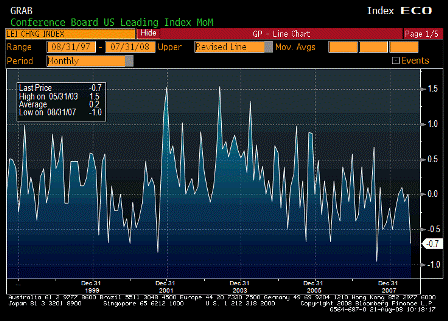
Leading Indicators (Jul)
| Survey | -0.2% |
| Actual | -0.7% |
| Prior | -0.1% |
| Revised | 0.0% |
Worse than expected. This is a domestic demand indicator that has been trending down for quite a while.
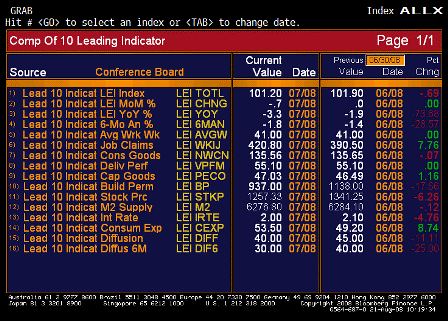
Leading Indicators ALLX (Jul)
A lot of the specifics seem questionable regarding relevance.
[top]


