- ICSC-UBS Store Sales WoW (Released 7:45 EST)
- ICSC-UBS Store Sales YoY (Released 7:45 EST)
- Redbook Store Sales Weekly YoY (Released 8:55 EST)
- ICSC-UBS Redbook Comparison TABLE (Released 8:55 EST)
- S&P-Case Shiller Home Price Index (Released 9:00 EST)
- S&P-CS Composite-20 YoY (Released 9:00 EST)
- Case Shiller ALLX 1 (Released 9:00 EST)
- Case Shiller ALLX 2 (Released 9:00 EST)
- Consumer Confidence (Released 10:00 EST)
- Consumer Confidence ALLX 1 (Released 10:00 EST)
- Consumer Confidence ALLX 2 (Released 10:00 EST)
- ABC Consumer Confidence (Released 17:00 EST)
- ABC Consumer Confidence ALLX (Released 17:00 EST)
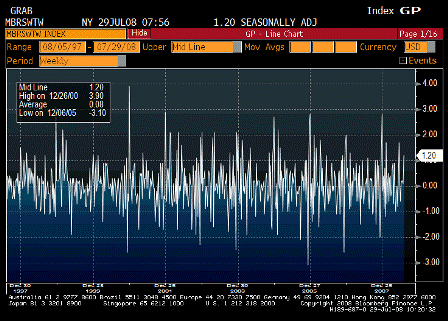
ICSC-UBS Store Sales WoW (Jul 29)
| Survey | n/a |
| Actual | 1.2% |
| Prior | 0.1% |
| Revised | n/a |
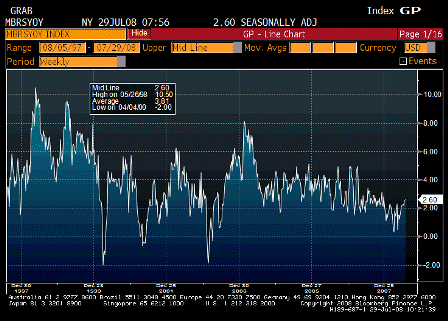
ICSC-UBS Store Sales YoY (Jul 29)
| Survey | n/a |
| Actual | 2.6% |
| Prior | 2.5% |
| Revised | n/a |
Still inching higher.
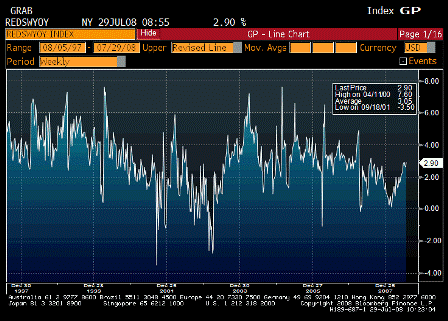
Redbook Store Sales Weekly YoY (Jul 29)
| Survey | n/a |
| Actual | 2.9% |
| Prior | 2.6% |
| Revised | n/a |
No let up here yet either.
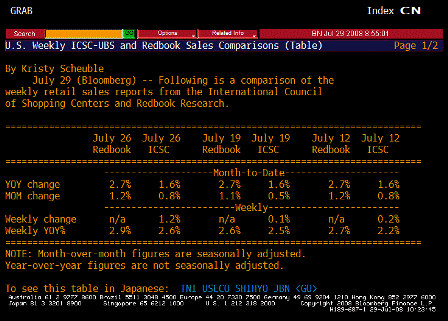
ICSC-UBS Redbook Comparison TABLE (Jul 29)
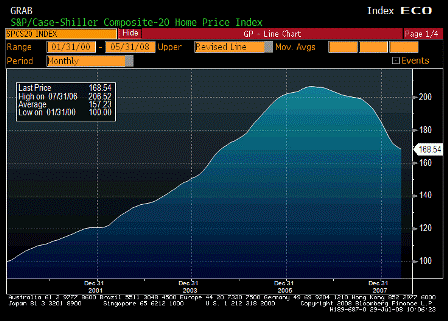
S&P-Case Shiller Home Price Index (May)
| Survey | n/a |
| Actual | 168.54 |
| Prior | 169.85 |
| Revised | 170.00 |
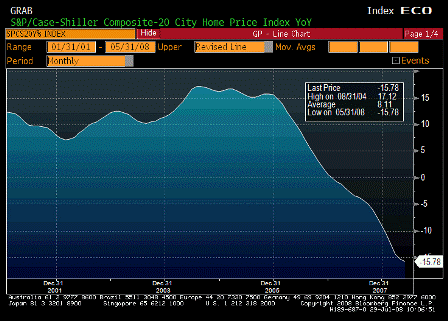
S&P-CS Composite-20 YoY (May)
| Survey | -16.00% |
| Actual | -15.78% |
| Prior | -15.30% |
| Revised | -15.22% |
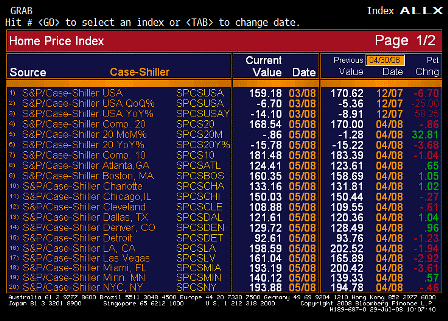
Case Shiller ALLX 1 (May)
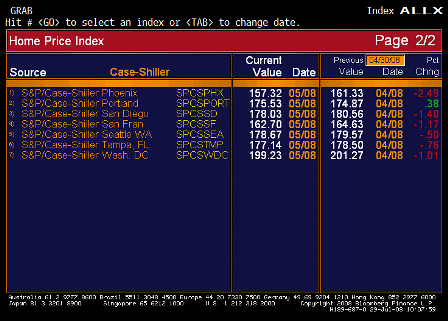
Case Shiller ALLX 2 (May)
Still declining but the rate of decline is quickly diminishing,
In line with other housing indicators that are appear to have bottomed.
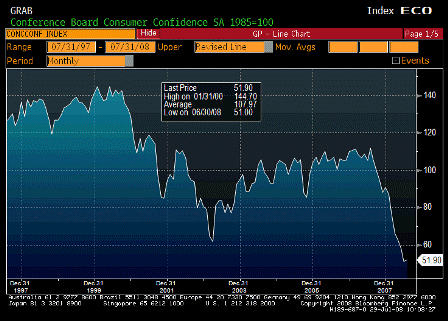
Consumer Confidence (Jul)
| Survey | 50.1 |
| Actual | 51.9 |
| Prior | 50.4 |
| Revised | 51.0 |
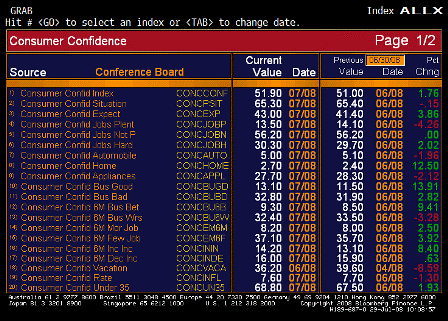
Consumer Confidence ALLX 1 (Jul)
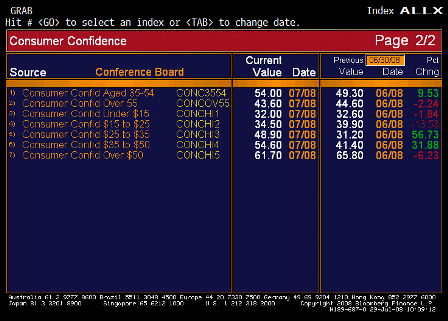
Consumer Confidence ALLX 2 (Jul)
| Survey | – |
| Actual | – |
| Prior | – |
| Revised | – |
Karim writes:
- Headline confidence rises from 51 to 51.9 (first gain since Dec)
- Jobs Plentiful less jobs hard to get falls from -15.6 to -16.8 (new cycle low); with initial claims back above 400k now, payrolls on Friday have downside risk to -75k consensus. As important, increasing jobs hard to get is correlated to increasing duration of unemployment.
- Plans to buy an auto fall to new cycle low of 5.0 from 5.1
- Plans to buy a home increases from cycle low of 2.4 to 2.7
- Plans to buy a major appliance fall to new cycle low of 27.7 from 28.3

ABC Consumer Confidence (Jul 27)
| Survey | – |
| Actual | – |
| Prior | -41 |
| Revised | – |

ABC Consumer Confidence ALLX (Jul 27)
[top]


