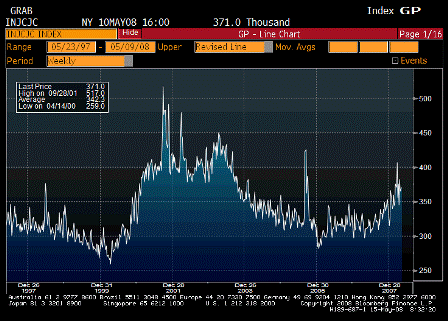
- Initial Jobless Claims (Released 8:30 EST)
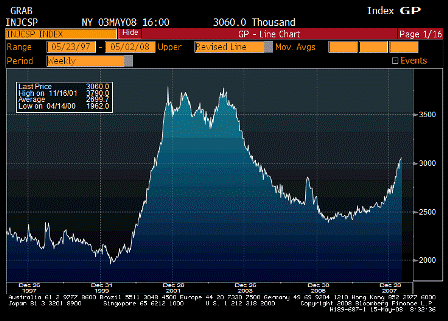
- Continuing Claims (Released 8:30 EST)
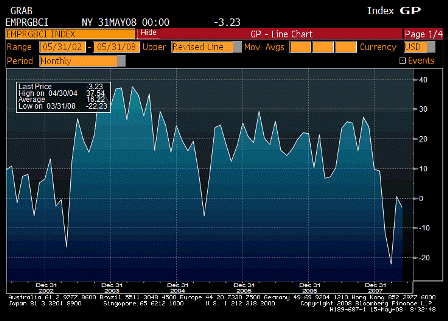
- Empire Manufacturing (Released 8:30 EST)
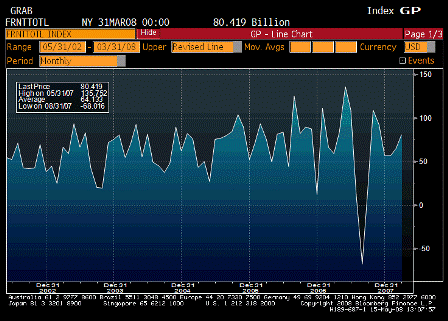
- Net Long-term TIC Flows (Released 9:00 EST)
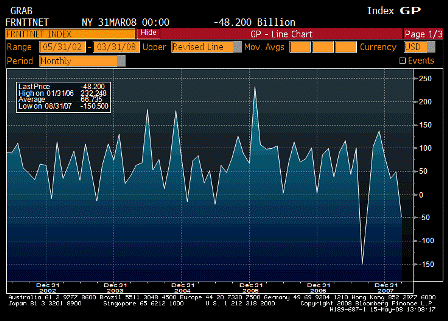
- Total Net TIC Flows (Released 9:00 EST)
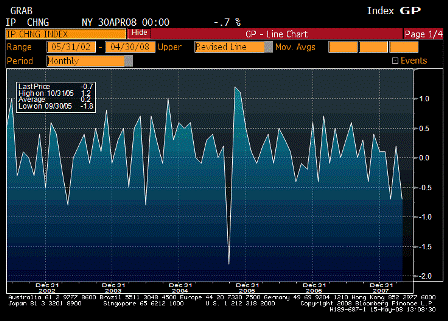
- Industrial Production (Released 9:00 EST)
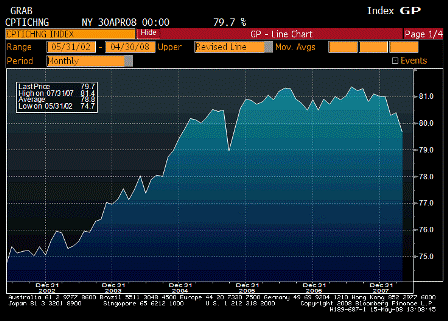
- Capacity Utilization (Released 9:15 EST)
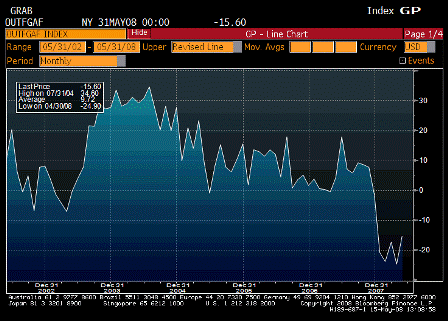
- Philadelphia Fed. (Released 10:00 EST)
- NAHB Housing Market Index (Released 13:00 EST)
Initial Jobless Claims (May 10)
| Survey | 370K |
| Actual | 371K |
| Prior | 365K |
| Revised | n/a |
Looks like it’s past the peak.
Continuing Claims (May 3)
| Survey | 3035K |
| Actual | 3060K |
| Prior | 3020K |
| Revised | 3032K |
Looks like it’s not past the peak.
Empire Manufacturing (May)
| Survey | 0.0 |
| Actual | -3.2 |
| Prior | 0.6 |
| Revised | n/a |
Still off the bottom, needs another month to see where it’s going.
Net Long-term TIC Flows (Mar)
| Survey | $62.5B |
| Actual | $80.4B |
| Prior | $72.5B |
| Revised | $64.9B |
Total Net TIC Flows (Mar)
| Survey | $67.5B |
| Actual | -$48.2B |
| Prior | $64.1B |
| Revised | $48.9B |
In general I expect these types of numbers to follow the trade gap down.
Industrial Production (Apr)
| Survey | -0.3% |
| Actual | -0.7% |
| Prior | 0.3% |
| Revised | 0.2% |
Still weak. Been weak for 50 years.
Capacity Utilization (Apr)
| Survey | 80.1% |
| Actual | 79.7% |
| Prior | 80.5% |
| Revised | 80.4% |
Weak, but not recession levels yet.
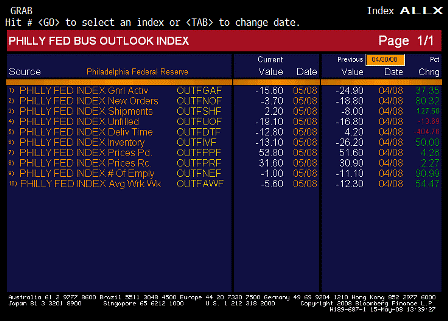
Philadelphia Fed. (May)
| Survey | -19.0 |
| Actual | -15.6 |
| Prior | -24.9 |
| Revised | n/a |
Philadelphia Fed. TABLE
Perking up from low levels,
prices high and moving higher
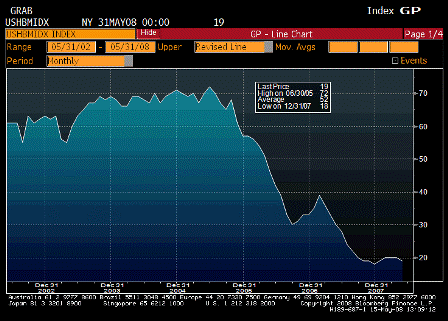
NAHB Housing Market Index (May)
| Survey | 20 |
| Actual | 19 |
| Prior | 20 |
| Revised | n/a |
Still off the lows and looking like a bottom to me.
[top]

