- Producer Price Index
- Empire Manufacturing
- NAHB Housing Market Index
- ABC Consumer Confidence
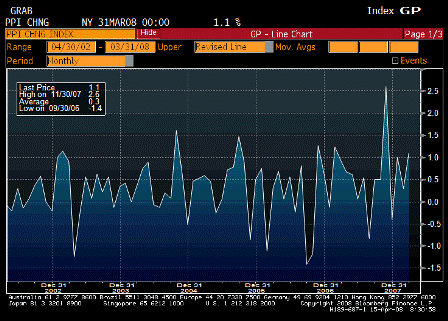
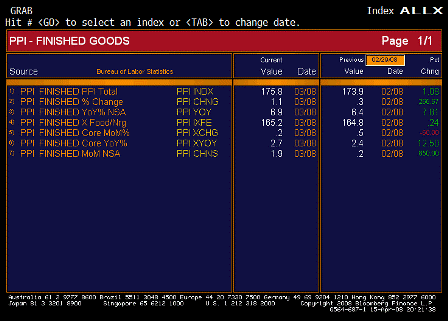
Producer Price Index MoM (Mar)
| Survey | 0.6% |
| Actual | 1.1% |
| Prior | 0.3% |
| Revised | n/a |
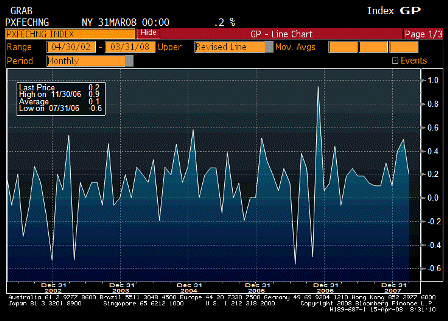
PPI Ex Food & Energy MoM (Mar)
| Survey | 0.2% |
| Actual | 0.2% |
| Prior | 0.5% |
| Revised | n/a |
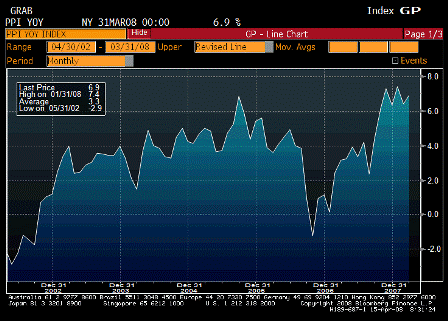
Producer Price Index YoY (Mar)
| Survey | 6.2% |
| Actual | 6.9% |
| Prior | 6.4% |
| Revised | n/a |
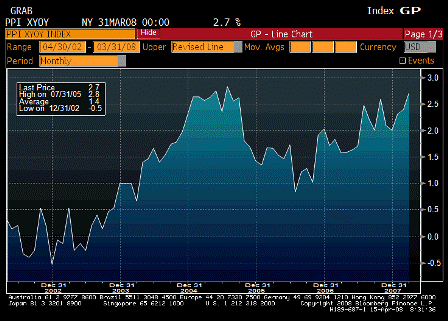
PPI Ex Food & Energy YoY (Mar)
| Survey | 2.8% |
| Actual | 2.7% |
| Prior | 2.4% |
| Revised | n/a |
Producer Price Index TABLE
Inflation ripping.
From Karim:
Headline/Core divergence continues
- Headline up 1.1% m/m and 6.9% y/y
- Core up 0.2% m/m and 2.7% y/y
- Food (+1.2%) and gas (+1.3%) lead the way up, computers (-3.2%) and passenger cars (-0.2%) lead the way down.
- Intermediate and crude pressures remain intense, rising 2.3% and 8.0% respectively for the month
- Further margin squeeze likely to put further downward pressure on capex, especially in light of weak economy and credit conditions (see below)
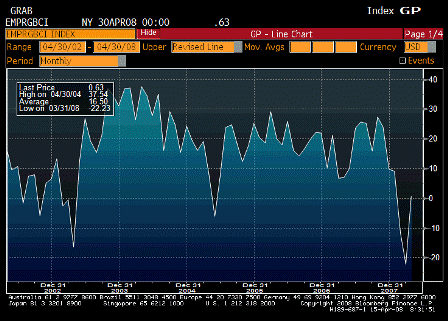
Empire jumps from -22.2 to 0.6. Index quite volatile and 10-20 point moves per month the norm as of late.
6mth expectations deteriorate from 25.8 to 19.6.
- Shipments show largest jump from -5 to +17 (for current conditions)
- Employment and average workweek both extremely weak
- Capex intentions fall from 18 to 11.5
Empire Manufacturing (Apr)
| Survey | -17.0 |
| Actual | 0.6 |
| Prior | -22.2 |
| Revised | n/a |
Survey is colored by subjective recessions fears bouncing back some.
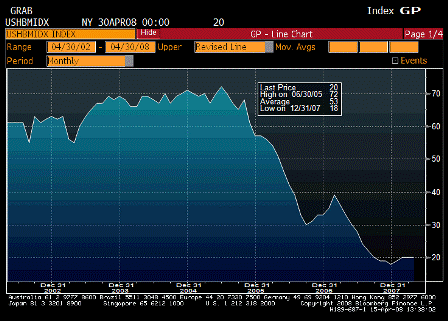
NAHB Housing Market Index (Apr)
| Survey | 20 |
| Actual | 20 |
| Prior | 20 |
| Revised | n/a |
Still looks to me like a bottom.
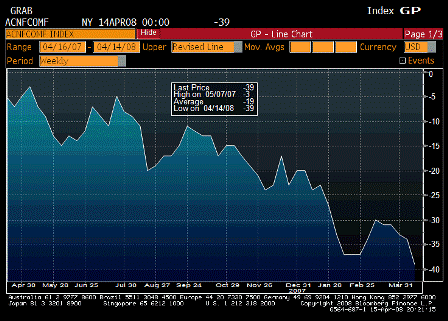
ABC Consumer Confidence (Apr 13)
| Survey | n/a |
| Actual | -39 |
| Prior | -34 |
| Revised | n/a |
Still looking weak. Much like an export economy

