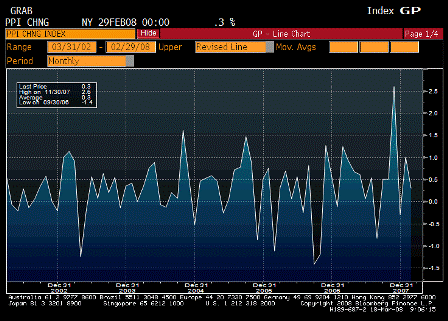
Producer Price Index MoM (Feb)
| Survey | 0.4% |
| Actual | 0.3% |
| Prior | 1.0% |
| Revised | n/a |
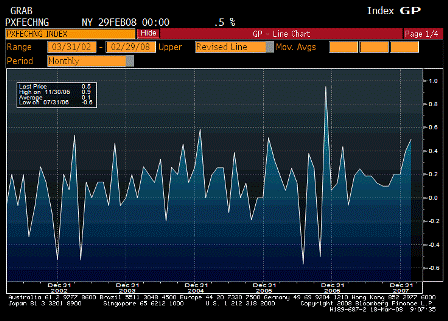
PPI Ex Food & Energy MoM (Feb)
| Survey | 0.2% |
| Actual | 0.5% |
| Prior | 0.4% |
| Revised | n/a |
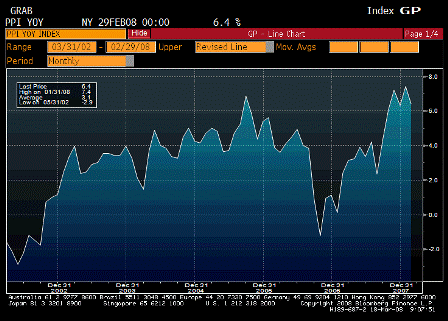
Producer Price Index YoY (Feb)
| Survey | 6.8% |
| Actual | 6.4% |
| Prior | 7.4% |
| Revised | n/a |
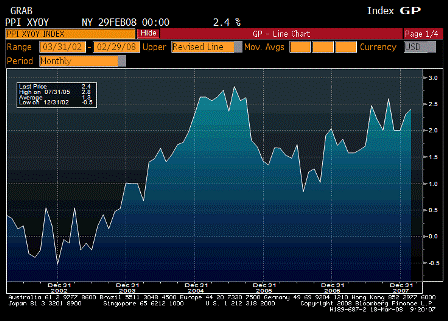
PPI Ex Food & Energy YoY (Feb)
| Survey | 2.1% |
| Actual | 2.4% |
| Prior | 2.3% |
| Revised | n/a |
Troubling as the Fed has indicated it’s getting passed through to core CPI measures.
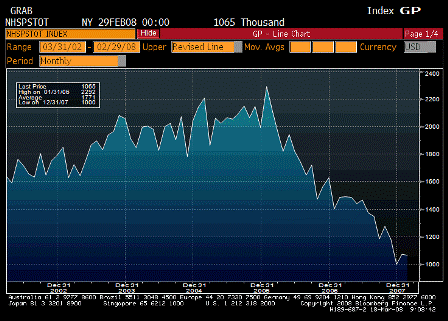
Housing Starts (Feb)
| Survey | 995K |
| Actual | 1065K |
| Prior | 1012K |
| Revised | 1071K |
More indications of a possible bottom in housing, meaning it won’t be subtracting as much from GDP for the rest of the year.
Karim Basta:
Housing starts fall 0.6% in Feb, but January revised higher by 5.8%.
One notable trend is single vs multi-family starts. The latter has now risen for 3 straight months, whereas the former continues to decline across most regions. A couple explanations out there-foreclosures, real income weakness driving trend towards apartments/condos vs homes.
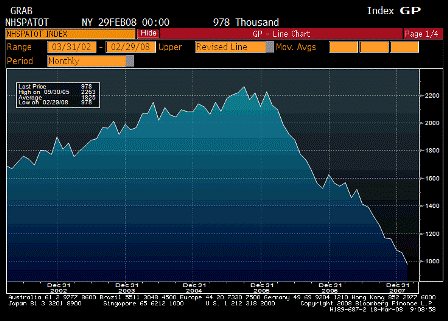
Permits fall another 7.8%; suggesting more declines in housing contribution to GDP going forward.
Margin squeeze evident in PPI as headline rises 0.3% and core by 0.5%.
Building Permits (Feb)
| Survey | 1020K |
| Actual | 978K |
| Prior | 1048K |
| Revised | 1061K |
Looking down, but the prior revision might be more relevant.
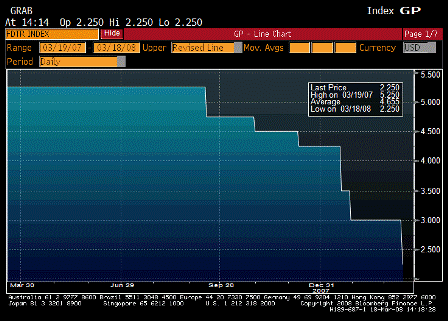
FOMC Rate Decision (Mar 18)
| Survey | 2.25% |
| Actual | 2.25% |
| Prior | 3.00% |
| Revised | n/a |
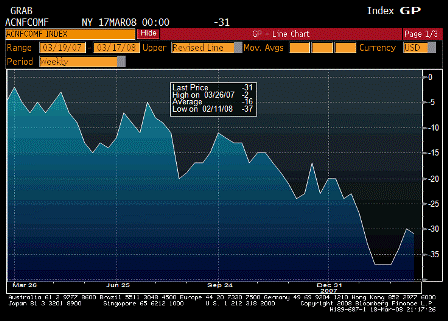
ABC Consumer Confidence (Mar 16)
| Survey | n/a |
| Actual | -31 |
| Prior | -30 |
| Revised | n/a |
Yet another chart that may have bottomed?

