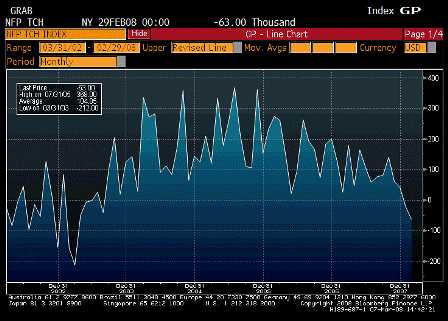
Change in Nonfarm Payrolls (Feb)
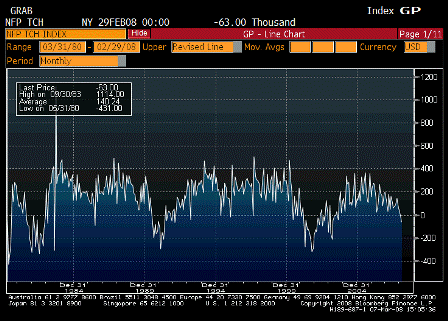
Change in Nonfarm Payrolls since 1980
| Survey | 23K |
| Actual | -63K |
| Prior | -17K |
| Revised | -22K |
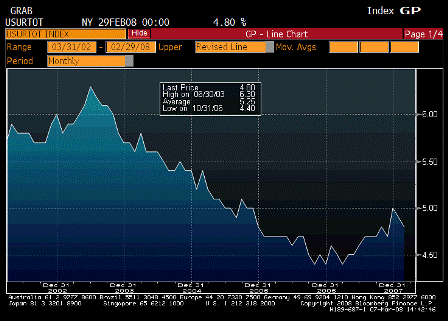
Unemployment Rate (Feb)
| Survey | 5.0% |
| Actual | 4.8% |
| Prior | 4.9% |
| Revised | n/a |
The longer term chart is definitely looking lower/weaker, but not yet at recession levels, and is not ‘population adjusted.’
This give the Fed no comfort regarding inflation concerns.
The output gap is may already too low to bring inflation down, and their forecasts are for a (modest) pickup in growth when the fiscal package kicks in beginning early May.
In their models, it’s the forecast of rising unemployment that is responsible for the slack that brings inflation back into comfort zones.
Today’s 4.8% unemployment number is a step in the wrong direction for that to happen.
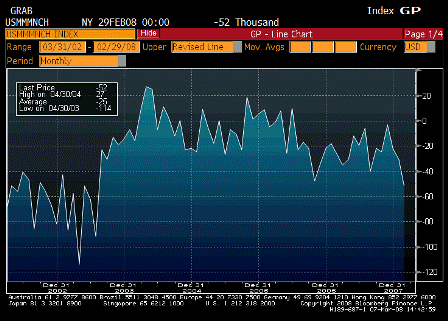
Change in Manufacturing Payrolls (Feb)
| Survey | -25K |
| Actual | -52K |
| Prior | -28K |
| Revised | -31K |
Manufacturing employment falls indefinitely in a modern economy.
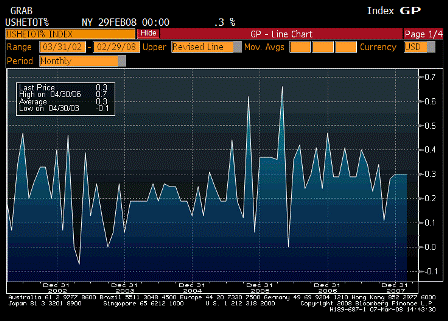
Average Hourly Earnings MoM (Feb)
| Survey | 0.3% |
| Actual | 0.3% |
| Prior | 0.2% |
| Revised | 0.3% |
The Fed wants these to remain reasonably well-contained.
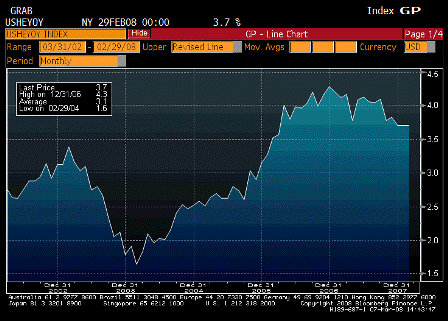
Average Hourly Earnings YoY (Feb)
| Survey | 3.6% |
| Actual | 3.7% |
| Prior | 3.7% |
| Revised | n/a |
As above.
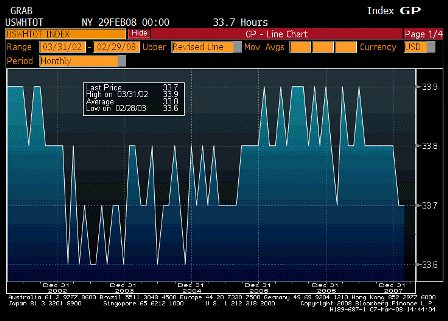
Average Weekly Hours (Feb)
| Survey | 33.7 |
| Actual | 33.7 |
| Prior | 33.7 |
| Revised | n/a |
Down a tad.
Coming soon!
Consumer Credit (Jan)
| Survey | $7.0B |
| Actual | — |
| Prior | $4.5B |
| Revised | — |
[comments]

