
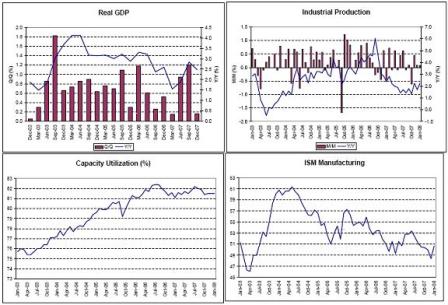
While the actual numbers don’t look bad…
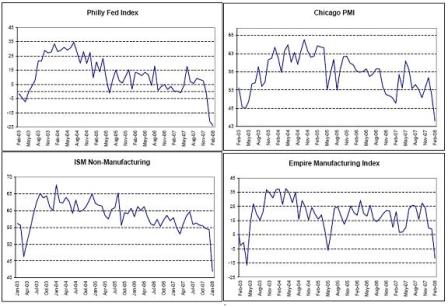
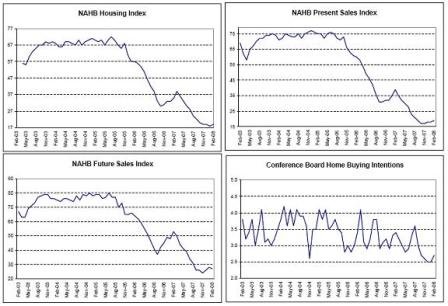
The surveys look ominous.
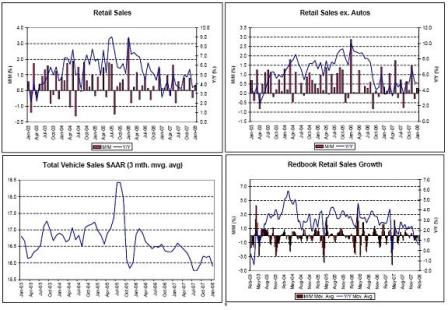
And retail hit a soft spot at year end.
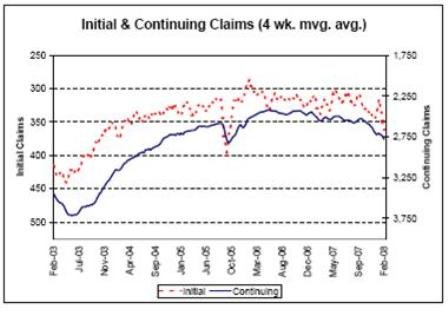
Employment data not a recession levels but weaker nonetheless.
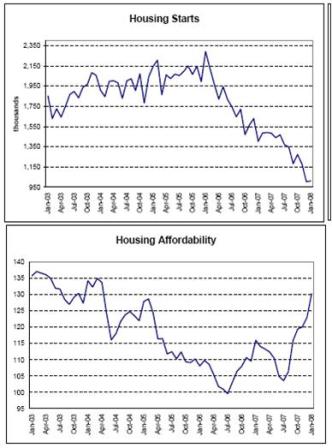
Housing subtracted 1.25% for Q4, but some signs that while weak, it won’t be nearly as negative for GDP going forward.
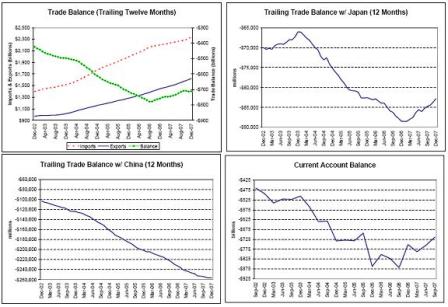
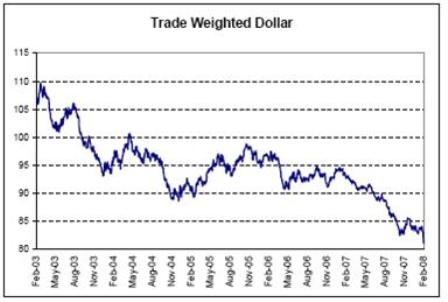
Exports (non-residents reducing their accumulation of $US financial assets) are doing their thing and supporting GDP.
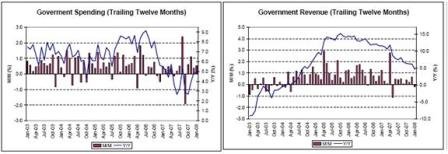
Government spending making a comeback and revenues not near recession levels yet.
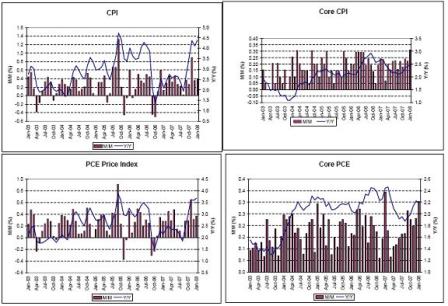
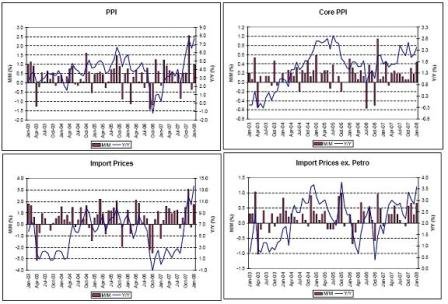
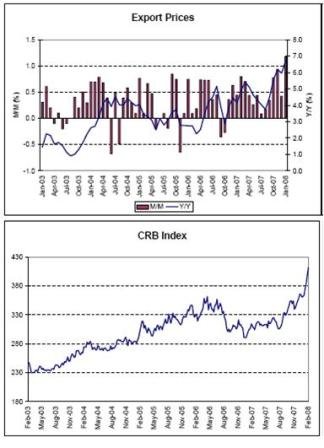
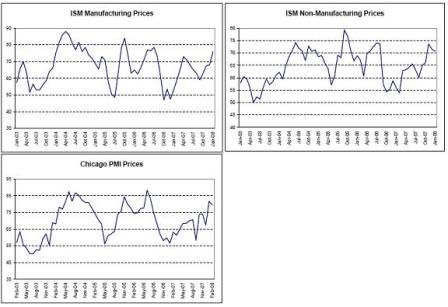
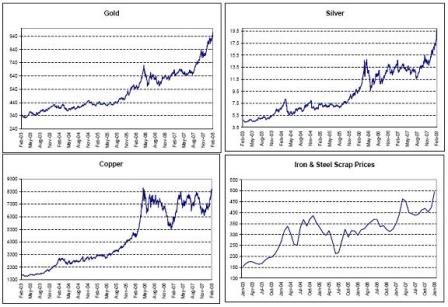
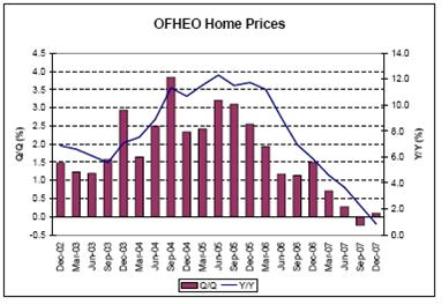
These charts say it all about prices.
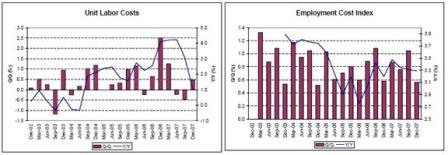
These look okay. Some FOMC members are waiting for them to turn up before they are convinced we have an inflation problem. Others think it will be too late when that happens.
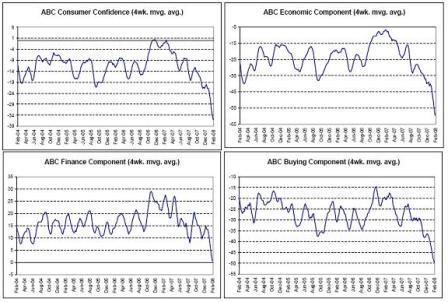
And confidence is at an all time low.
Not the least because higher prices are making it tougher for households to make ends meet.
Might that be an inflation problem???