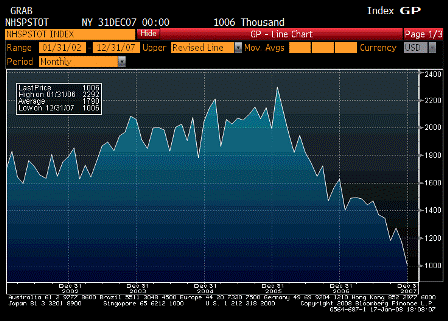
Housing Starts (Dec)
| Survey | 1145K |
| Actual | 1006K |
| Prior | 1187K |
| Revised | 1173K |
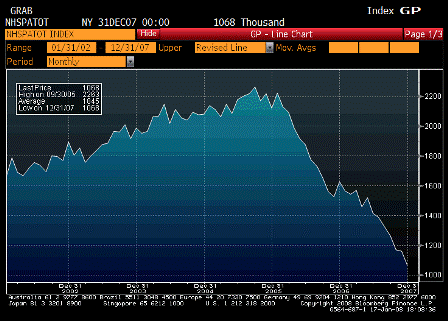
Building Permits (Dec)
| Survey | 1135K |
| Actual | 1068K |
| Prior | 1152K |
| Revised | 1162K |
Both still in free fall – may be weather distorted some, but they don’t look good.
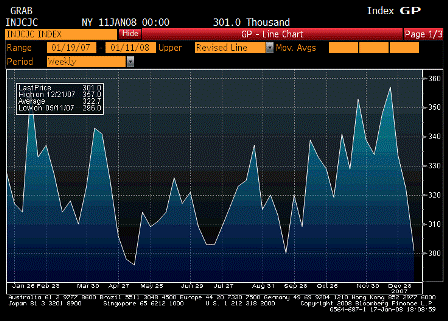
Initial Jobless Claims (Jan 12)
| Survey | 331K |
| Actual | 301K |
| Prior | 322K |
| Revised | n/a |
All the way back down. Seems out of line with housing and Philly Fed.
Could be the government spending kicking in that will subsequently support housing and other spending. (See previous posts on government spending.)
Spending resuming its growth after sagging for a couple of quarters as spending got moved forward.
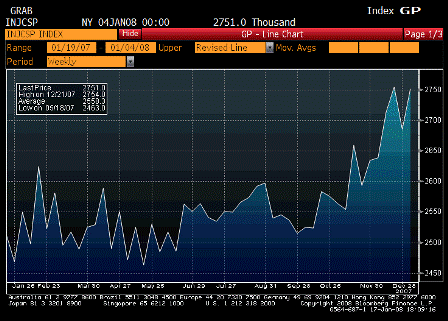
Continuing Claims (Jan 5)
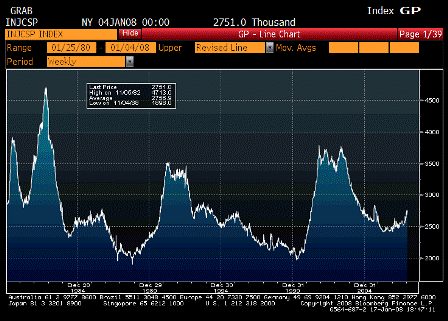
Continuing Claims since 1980
| Survey | 2750K |
| Actual | 2751K |
| Prior | 2702K |
| Revised | 2685K |
Back up, but this is a tiny blip on the longer term chart.
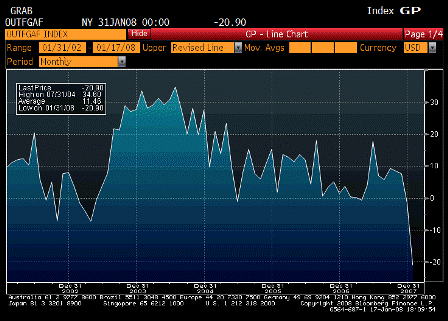
Philadelphia Fed. (Jan)
| Survey | -1.0 |
| Actual | -20.9 |
| Prior | -5.7 |
| Revised | n/a |
Falling off a cliff.
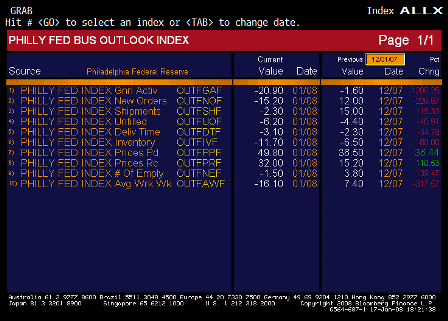
Philadelphia Fed. TABLE
Weakness in every category – except prices paid and received, which skyrocketed.
Adds to the fed’s dilemma.
♥

