Quite a few price increases, which the media now calls ‘inflation’ even though inflation is a continuous increase in the price level:
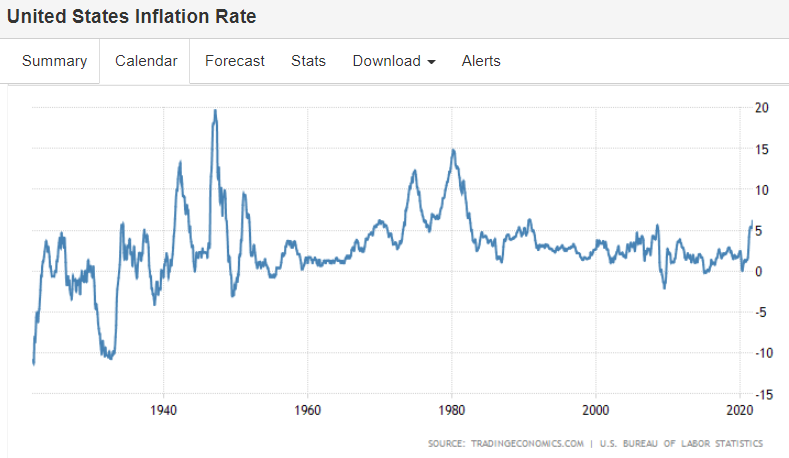
The annual inflation rate in the US surged to 6.2% in October of 2021, the highest since November of 1990 and above forecasts of 5.8%. Upward pressure was broad-based, with energy costs recording the biggest gain (30% vs 24.8% in September), namely gasoline (49.6%). Inflation also increased for shelter (3.5% vs 3.2%); food (5.3% vs 4.6%, the highest since January of 2009), namely food at home (5.4% vs 4.5%); new vehicles (9.8% vs 8.7%); used cars and trucks (26.4% percent vs 24.4%); transportation services (4.5% vs 4.4%); apparel (4.3% vs 3.4%); and medical care services (1.7% vs 0.9%). The monthly rate increased to 0.9% from 0.4% in September, also higher than forecasts of 0.6%, boosted by higher cost of energy, shelter, food, used cars and trucks, and new vehicles. source: U.S. Bureau of Labor Statistics
The longer term chart show how so far it’s just a one time blip up:
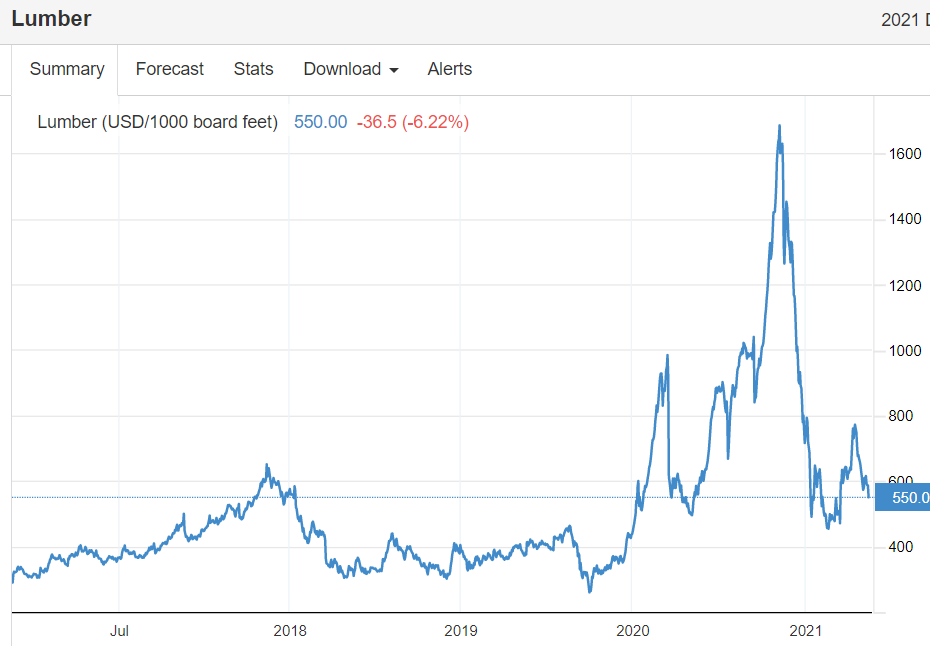
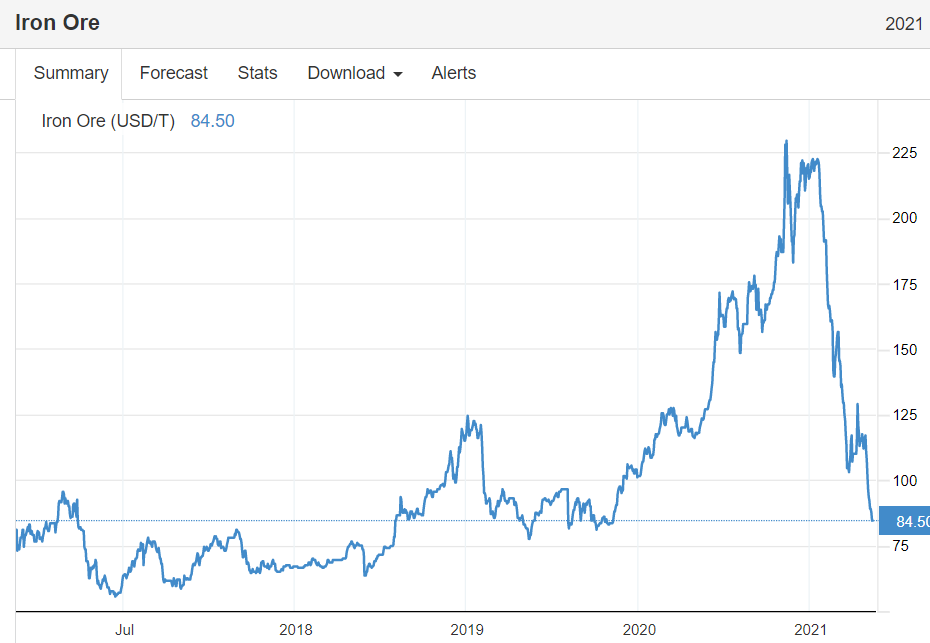
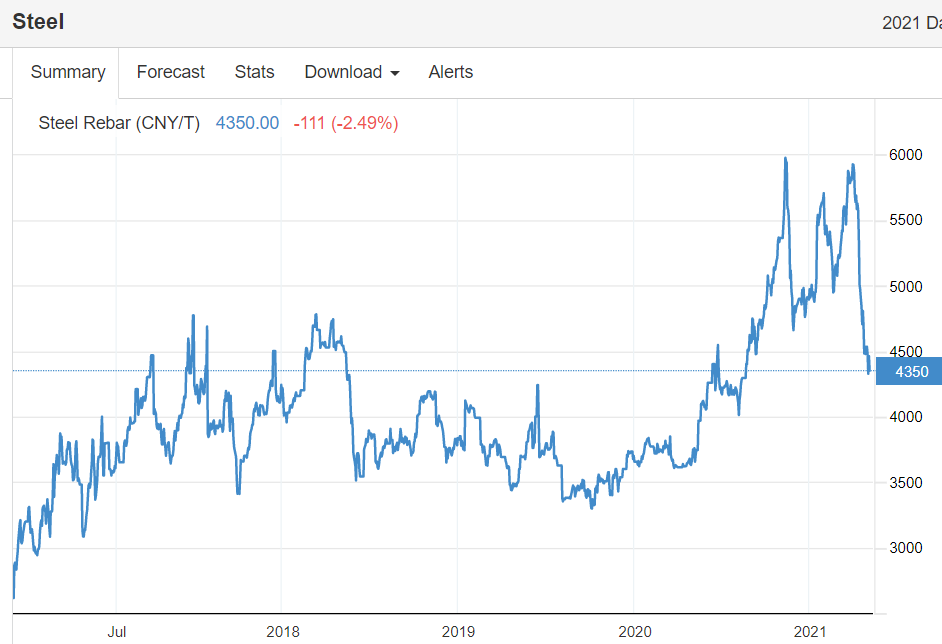
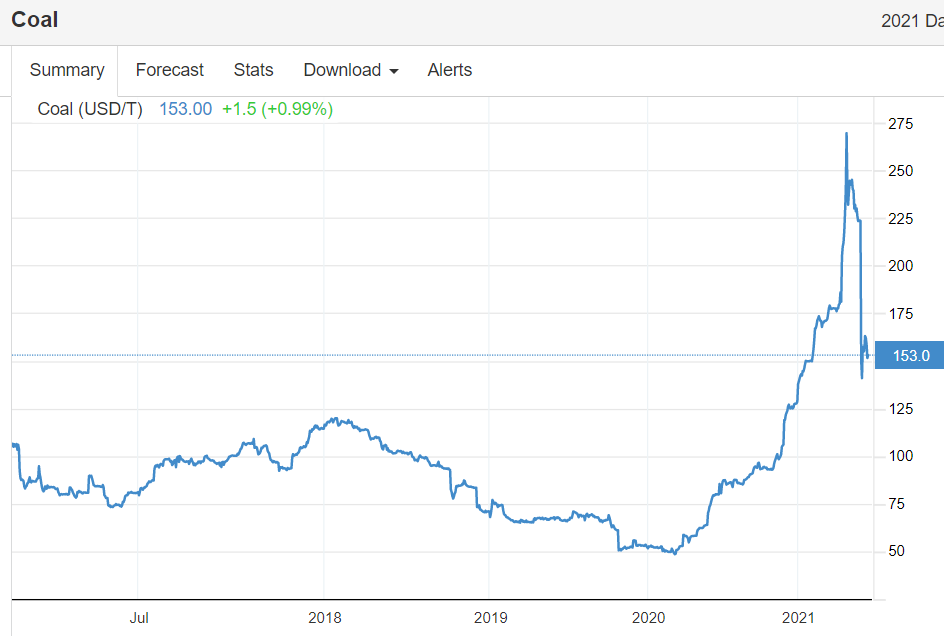
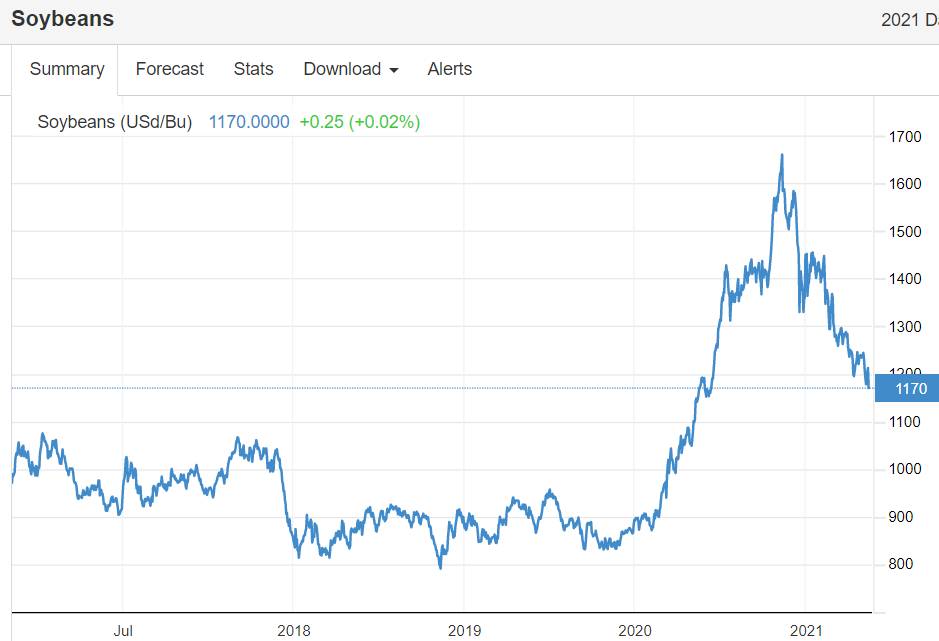
Quite a few commodities are also looking like it’s been a one time blip up:
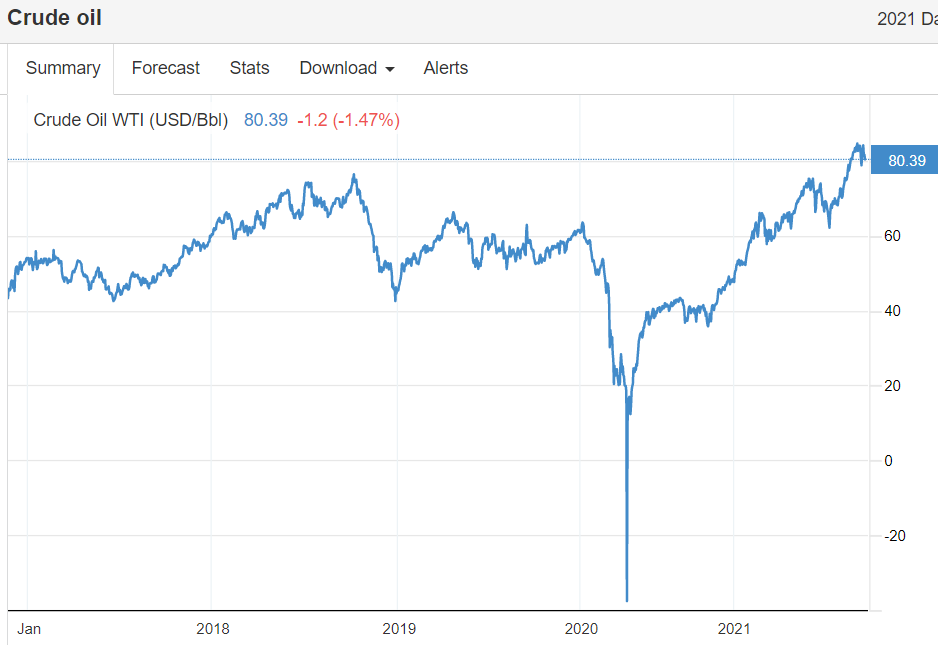
Oil prices, however are set by Saudi Arabia working closely with Russia,
so at least for the medium term the price is an entirely political decision: