
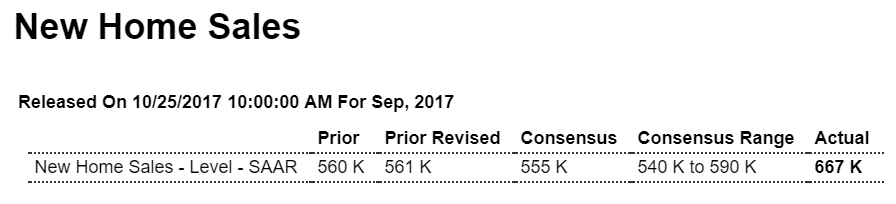
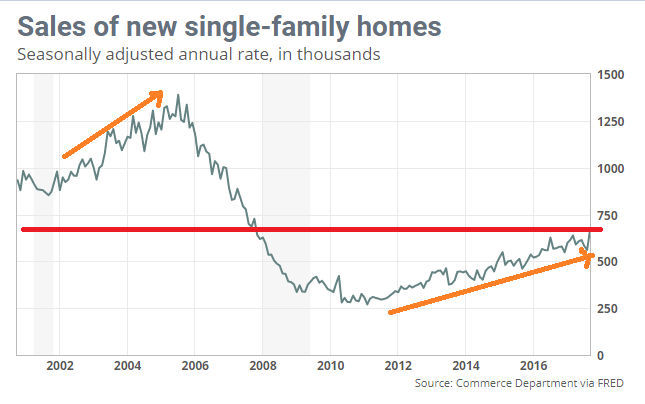
Nice uptick, but subject to revision and at best indicating continued very modest growth well below the last cycle with a population that’s maybe 10% higher than it was 10 years ago:
Highlights
Volatility tied to low sample sizes is what the new home sales report is known for, proving its reputation again as September surged 18.9 percent to a 667,000 annualized rate. This is the largest percentage gain in nearly 28 years and is the highest level of the economic cycle, since October 2007. The revision to August is surprisingly slight, now at 561,000 vs an initial 560,000.
If hurricanes affected the South in September, then they apparently lifted sales which rose 26 percent in the month to a 405,000 rate. Sales in the three other regions also rose, led by a 33 percent gain in the Northeast to a 48,000 rate and an 11 percent increase in the Midwest to 73,000. Sales in the West rose 2.9 percent to 141,000.
The surge in sales makes inventories look even more tight. The number of new homes on the market did hold unchanged in the month at 279,000 yet, relative to sales, supply fell 1 full month to 5.0 months.
Underscoring the strength of the data is strength in prices as sellers were not giving discounts. The median rose a very steep 5.2 percent in the month to $319,700. And prices may have further to run as the year-on-year gain, at only 1.6 percent, is far below the yearly sales rate of 17.0 percent.
The volatility that this report is subject to makes today’s results feel uneasy. The 3-month average tells a less dramatic story, at 603,000 which is roughly where the trend line has been much of the year. But September’s surge is still something to take notice of, and unless it’s revised away or simply proves a one-month wonder, the new home market may be accelerating sharply into year end.
There was clearly some rebound following hurricane Harvey. Sales in the South were up sharply from August, and at the highest level since July 2007. Some contracts in the South, that would have been signed in August, were probably delayed until September. Also some people who lost homes might have signed contracts for new homes in September (New home sales are counted when contracts are signed).
Read more at http://www.calculatedriskblog.com/#1C0h8I1iEJmLPf4I.99
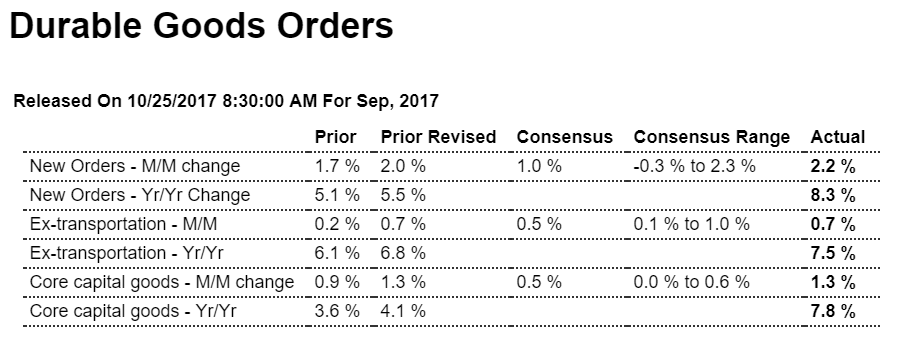
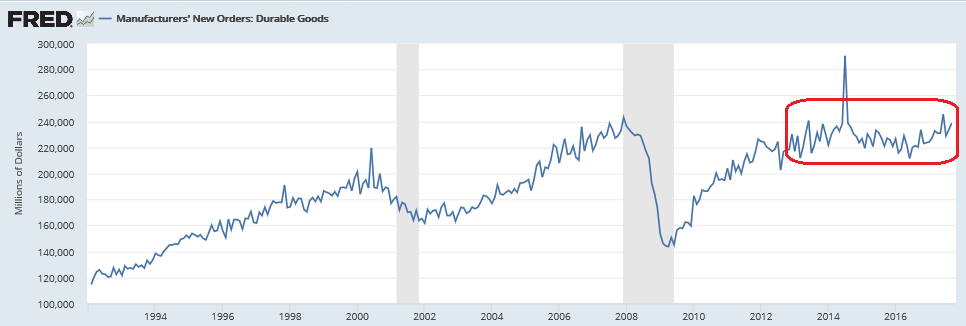
And the number circled in red looks a bit suspect?

Better than expected, supported by a large aircraft order, as manufacturing chugs along at modest rates of growth, with core capital goods looking up as well. However as per the chart, it’s not wrong to say it’s all been going sideways for the last several years:
Highlights
Business investment is picking up sharply based on capital goods orders which highlight a very favorable durable goods report. Durable orders jumped 2.2 percent in September which is right at Econoday’s high estimate. A second straight strong month for commercial aircraft, up 64 percent following a 52 percent gain in August, skewed the headline higher but when excluding transportation equipment, orders still managed a strong 0.7 percent gain.But its core capital goods orders (nondefense ex-aircraft) that show the most important strength, up 1.3 percent with the two prior months also at 1.3 percent. Shipments for this series, which are direct inputs into the business investment component of the GDP report, are building momentum with monthly gains of 0.7 percent in September following 1.2 and 1.0 percent gains in August and July.
One soft spot is vehicle orders which rose only fractionally. Hurricanes effects could not be isolated in September’s data and seasonal adjustment procedures were unchanged. Note that upward revisions to August data were first posted in the factory orders report.
Unfilled orders have been flat but rose 0.2 percent which are another positive of September’s report. And a rise in inventories will be another plus for GDP, up 0.6 percent and pointing to a monthly build for total factory inventories.
Year-on-year rates are really telling the story, now hitting highs last seen before the oil price collapse of 2014. Total orders are up a yearly 8.3 percent with ex-transportation up 7.5 percent and core capital goods up 7.8 percent.
With only one exception remaining, and that is manufacturing production in the Federal Reserve’s industrial production report, factory data are accelerating going into year end. Watch for the Kansas City manufacturing report on tomorrow’s calendar.
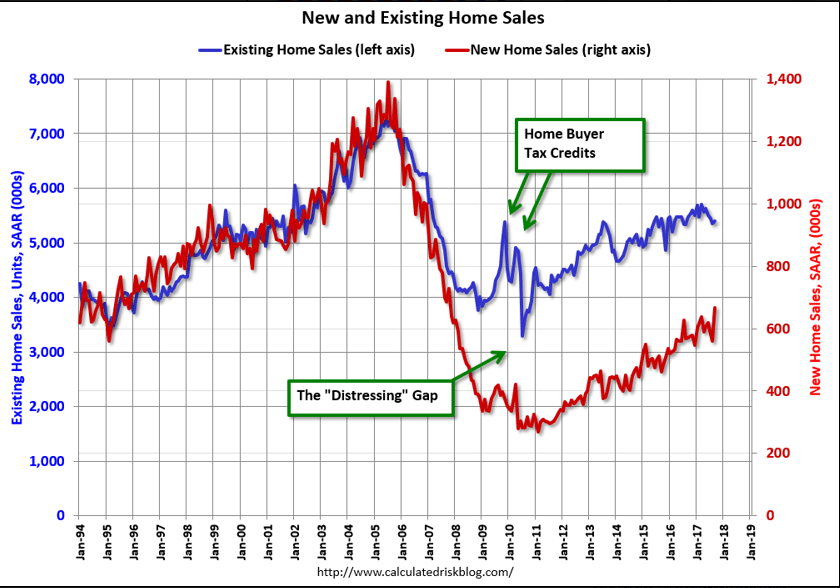
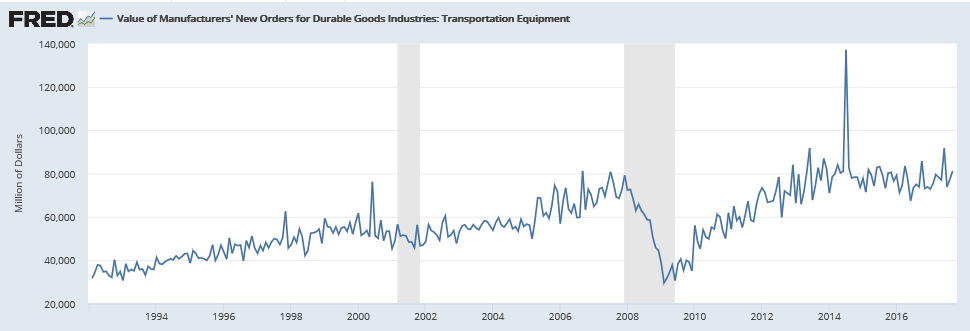
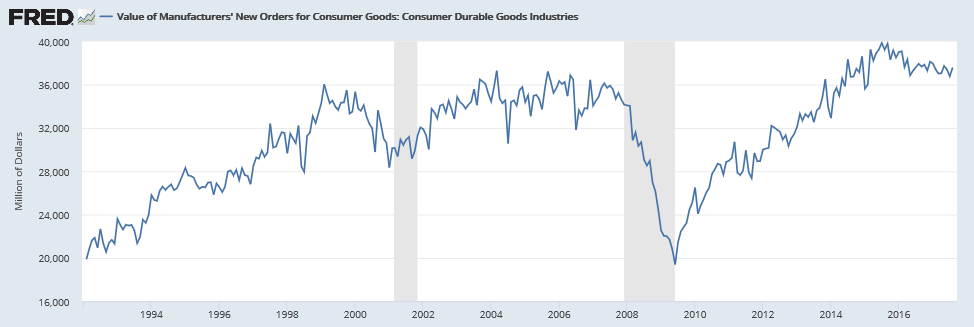
These charts are not inflation adjusted:

Consumer not looking so good:
Settling back down after replace orders from hurricane damage:
From WardsAuto: U.S. Forecast: October Auto Sales Rate Flat with Prior-Year
A WardsAuto forecast calls for U.S. automakers to deliver 1.31 million light vehicles in October. A daily sales rate of 52,579 units over 25 days is nearly equivalent to like-2016’s 52,584 units for 26 days. …
The report puts the seasonally adjusted annual rate of sales for October at 17.55 million units, behind year-ago’s 17.80 million and prior-month’s 18.48 million mark. emphasis added
Read more at http://www.calculatedriskblog.com/#f5XXWIM4C9kTSV7l.99