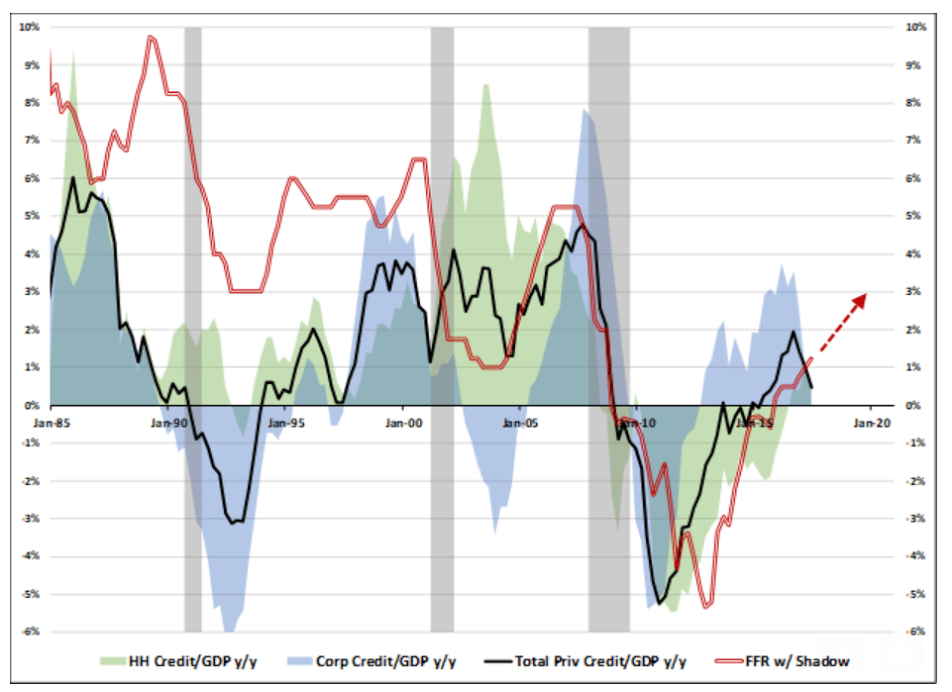
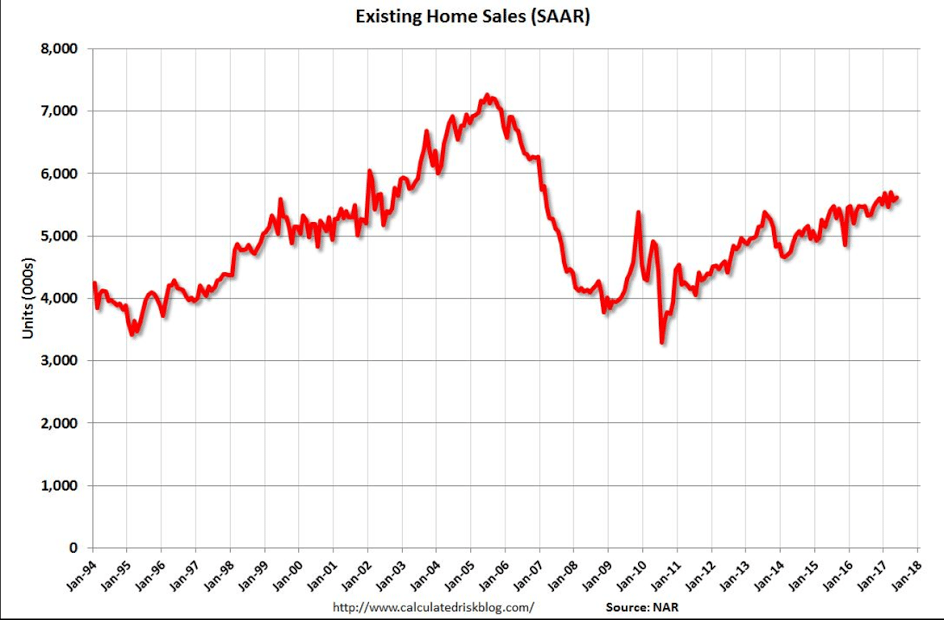
Going nowhere, and with mortgage lending decelerating not much hope this will add to growth vs last year:
Highlights
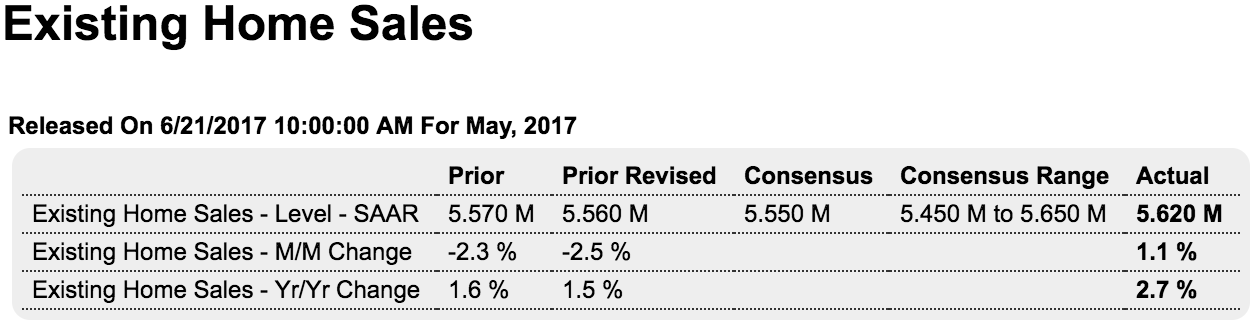
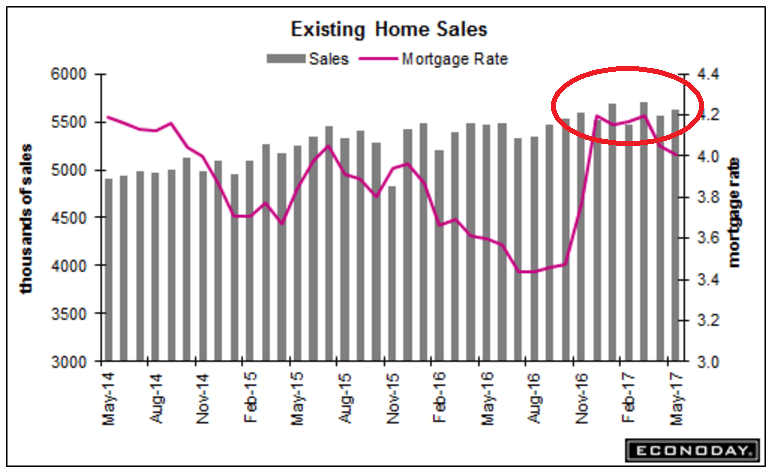
Housing has been sliding which adds importance to May’s very solid 1.1 percent rebound in existing home sales to a higher-than-expected 5.620 million annualized rate. Today’s report is mostly solid throughout and includes gains for single-family homes, up 1.0 percent to a 4.980 million rate, and also condos, up 1.6 percent to a 640,000 rate.
The sales gains did not come at the expense of price concessions as the median price rose 3.2 percent to $252,800. Year-on-year, the median is up 5.8 percent and shows seller strength relative to a 2.7 percent gain for on-year sales.
Another positive is supply which, aided by strength in prices, is moving into the market, to 1.960 million vs 1.920 million in April and 1.800 million in March. Relative to sales, supply is at 4.2 months vs 4.1 and 3.8 in the prior two months.
The South is the leading and by far the largest region for sales, up 2.2 percent on the month for a 4.5 percent on-year gain to a 2.340 million rate. The West is next, up a monthly 3.4 percent to 1.220 million and a 3.4 percent gain from last year. The Northeast, which had been lagging, is showing life, up 6.8 percent on the month with the year-on-year rate up 2.6 percent at 780,000. Sales in the Midwest are May’s only negative, down 5.9 percent and down 0.8 percent on the year at 1.280 million.
The housing sector opened the year strongly but mostly fizzled during the Spring selling season. Yet this report limits that weakness and should confirm expectations for a bounce back in Friday’s new home sales report. Watch next week for pending home sales which will offer an advance indication on existing home sales in June.
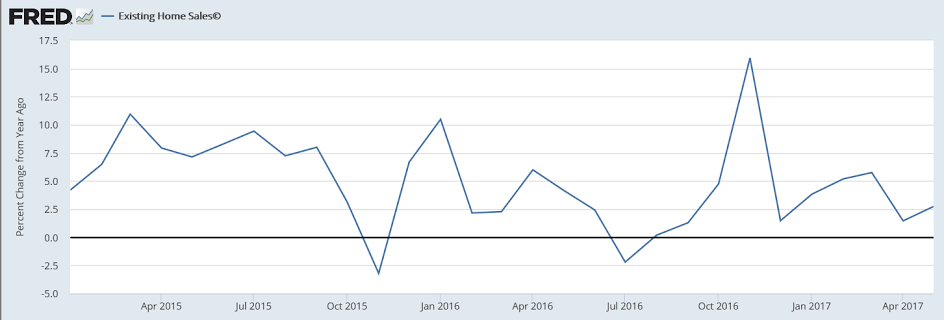
This is not population adjusted. Sales remain seriously depressed:
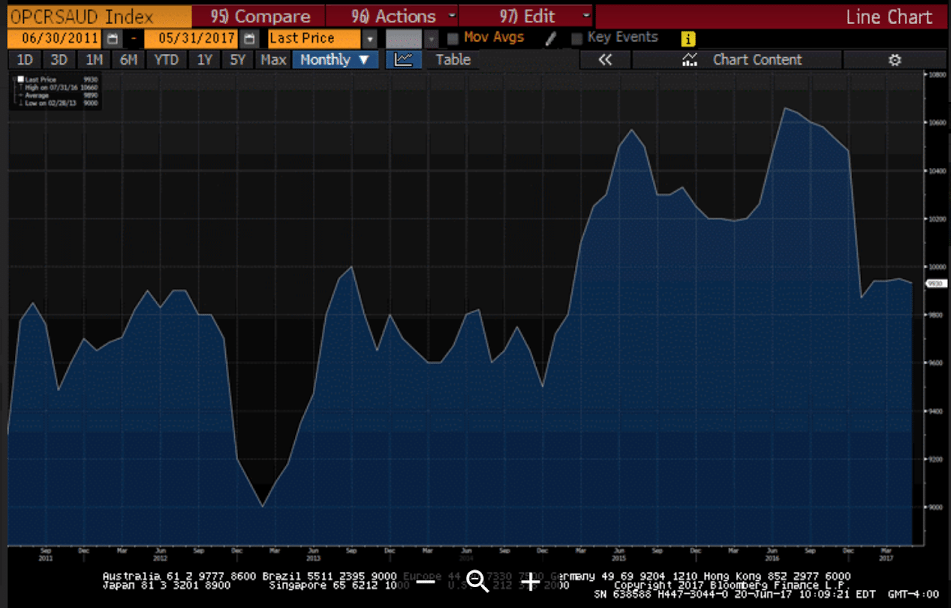
Saudi output holding steady at reasonable levels. The set price and let quantity adjust:
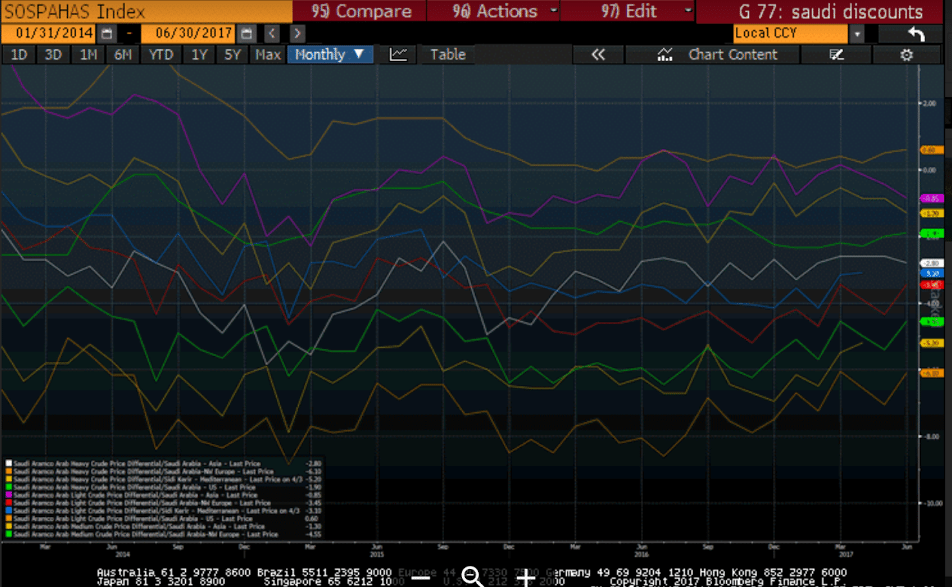
Seems they’ve been reducing discounts more than increasing them lately?
Word getting around about the lending slowdown as per this chart I recently saw: