
Just skip to the chart:
Highlights
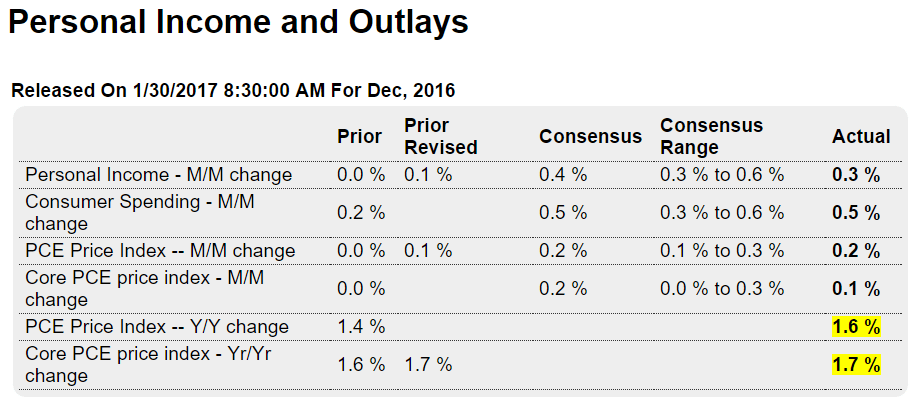
Personal income rose a moderate 0.3 percent in December with the wages & salaries component posting a slightly better gain at 0.4 percent. The savings rate, however, fell in the month, down 2 tenths to 5.4 percent which helped to fund a strong 0.5 percent gain in consumer spending. December’s spending was centered in a 1.4 percent rise for durable goods, boosted specifically by autos, but included a 0.4 percent gain for services and a 0.2 percent for nondurable goods.
Inflation data look tame but nevertheless continue to trend higher. The core PCE (less food & energy) inched only 0.1 percent higher with the year-on-year at 1.7 percent which is unchanged from an upwardly revised November. Total PCE prices, boosted by a 1.7 percent monthly rise in energy, rose 0.2 percent. But this year-on-year rate, which is the most important barometer for price change in the economy, is up 2 tenths to 1.6 percent which is the highest since the oil collapse in 2014 (July 2014).
In sum, income is still moderate and spending is solid though may be getting funded from savings. And for inflation hawks, PCE prices are closing in steadily toward the Fed’s 2 percent target.
The net income deceleration/meltdown continues, with no reason to suspect anything but more of same:
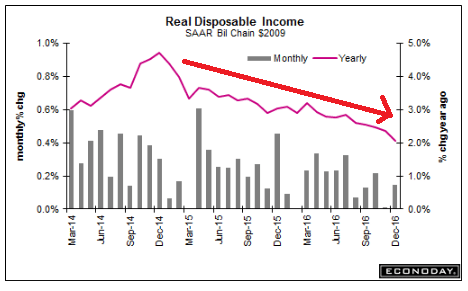
With income currently falling faster than consumption, I wouldn’t be surprised if consumption growth slows as well:
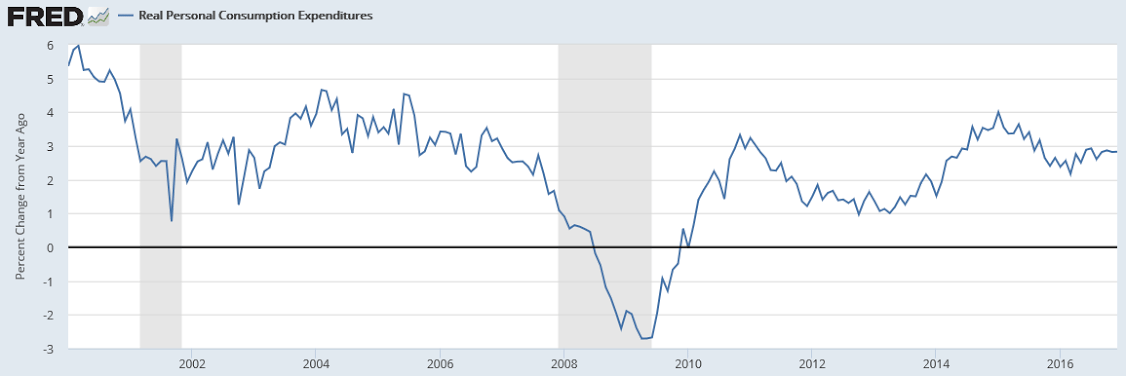
Skip to the chart here as well. The lack of income spills over into just about everything else:
Highlights
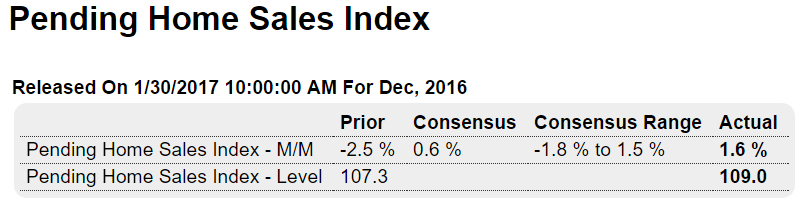
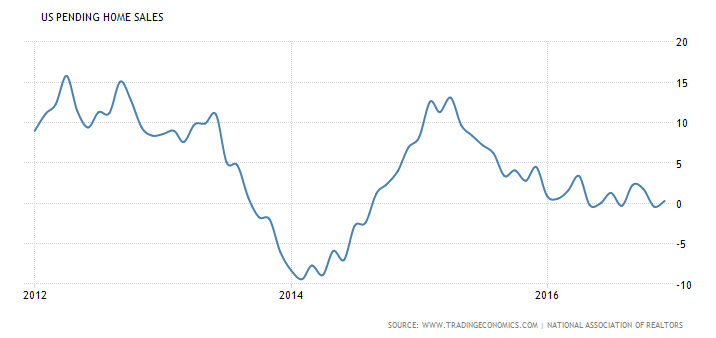
Existing home sales have been at cycle highs but have not been able to move above, yet new gains may perhaps be underway. The pending home sales index rose a very a strong 1.6 percent in December which is just above Econoday’s top estimate. Pending sales track contract signings for resales and the gain points squarely at January and February strength for final sales which are tracked in the existing home sales report..
Regional data for pending sales show the West out in front with a year-on-year gain of 5.0 percent. The Midwest trails with a 3.4 percent year-on-year decline. This is a light week for housing data though the Case-Shiller price report will be a highlight of tomorrow’s calendar.
More signs that the manufacturing sector is now muddling through:
Highlights
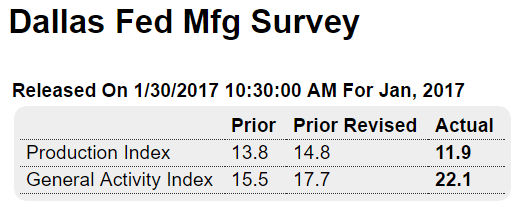
The Dallas Fed joins other regional reports pointing to strength for the nation’s factory sector. The production index did slow but remains in the double digits, at 11.9 in January vs a revised 14.8 for December. And new orders are on the rise, at 15.7 vs December’s 10.1 for the strongest showing since April 2014.
Unfilled orders, at a modest looking 5.2, are the strongest since June 2012. Employment is another positive, at 6.1 vs minus 3.4 for the best showing since December 2015. And the general activity index underscores the strength, at 22.1 vs an upward revised 17.7 and the best reading since all the way back at the beginning of the cycle in April 2010. Price data show slightly increasing pressures while inventories, reflecting the production strength, are on the decline.
This report offers a special look at the oil patch, underscoring that 2-1/2 tough years following the price collapse for oil are finally behind the sector.