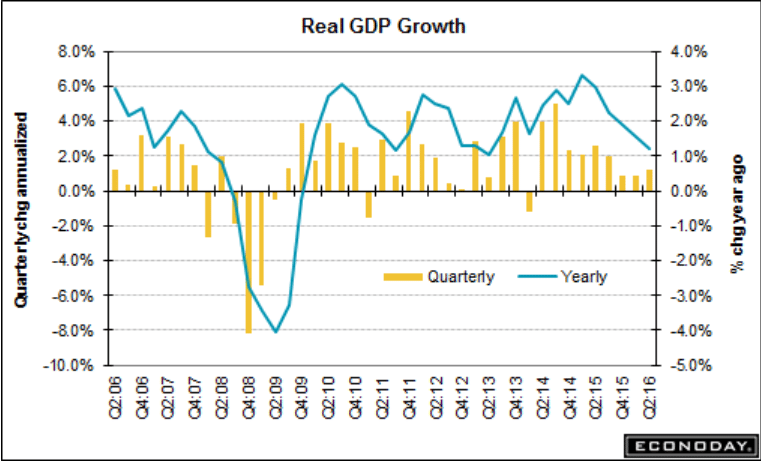
Worse than expected, Q1 revised lower, and note the year over year deceleration in the chart. The inventory correction previously discussed looks to be well underway and has much further to go to bring inventories into balance with sales.
Problem is, sales growth is declining, and the downward spiral will continue until ‘borrowing to spend’ steps up to support the negative effects of what I call unspent income, aka savings desires. And the historical drivers of private sector deficit spending- housing, cars, and business investment- are all going the wrong way.
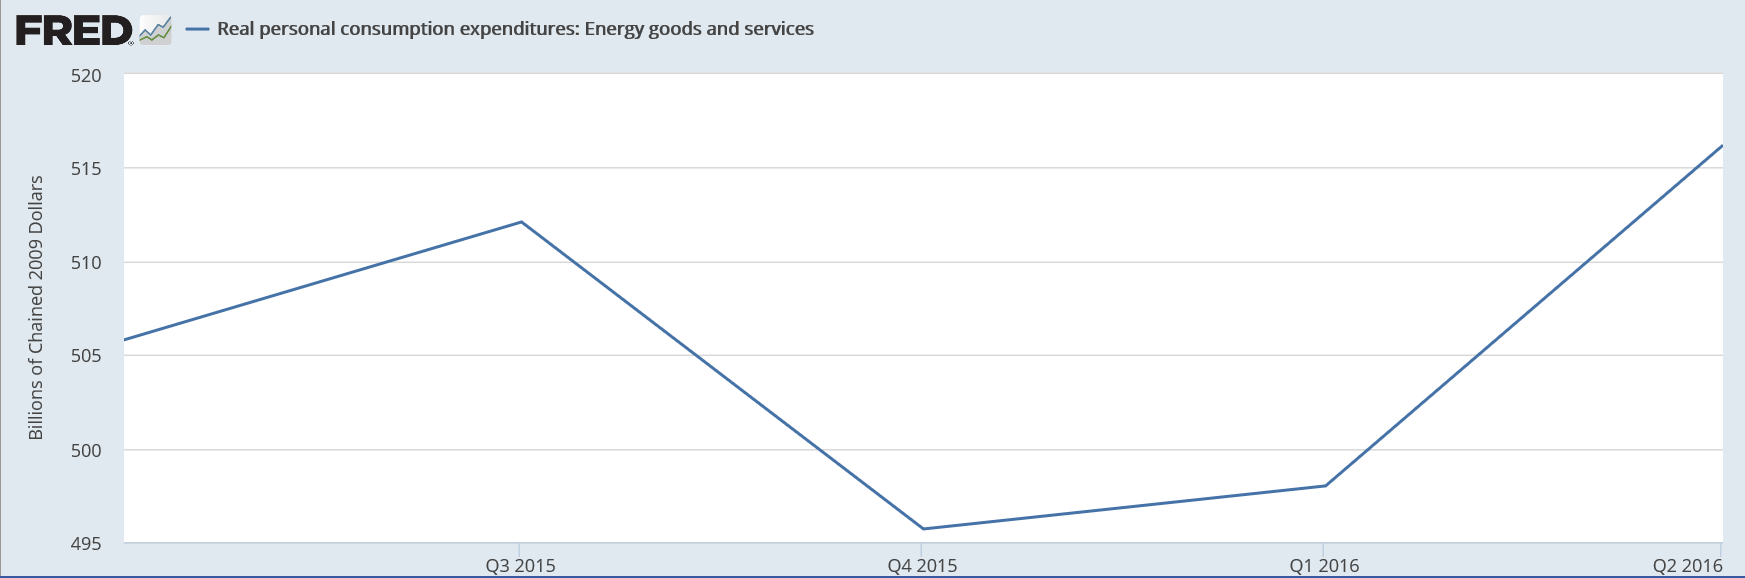
And note that the much touted increase in consumer spending was in energy purchases, as prices went up, which tends to reduce other consumer purchases over time:
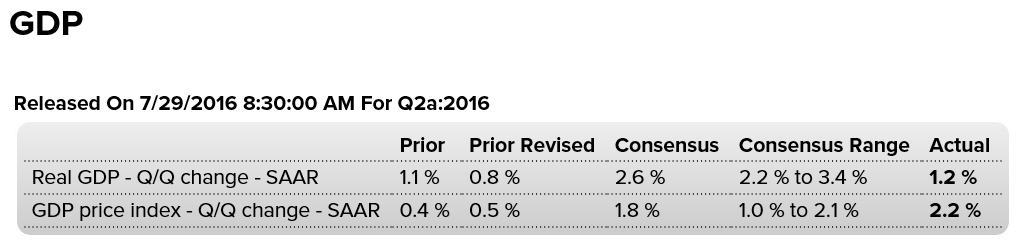
Highlights
Second-quarter GDP looks very weak at only a plus 1.2 percent annualized rate, but the details are positive. The biggest positive is consumer spending where growth, showing strength across readings, came in at a stellar 4.2 percent rate, more than double the first-quarter’s 1.6 percent rate.
A plus for the economy but a big negative in this report is slowing inventory accumulation which pulled down GDP by 1.2 percentage points in the quarter. But lean inventories point ahead to new accumulation which is a plus for future production and employment.
Another negative in the report is a reversal in residential investment, which had been running in the double-digit zone but which fell at an annualized 6.1 percent to pull down GDP in the second quarter by 2 tenths. A central concern remains nonresidential fixed investment, falling at a 2.2 percent rate and pulling down GDP by 3 tenths in the quarter. Weakness here points to weakness in business confidence and trouble ahead for productivity growth.
Price data do show some pressure with the overall index, reflecting the oil rebound, at 2.2 percent year-on-year, up from a revised 0.5 percent in the first quarter, but the core rate showing a little less pressure at 2.0 percent for, however, a still sizable 5 tenths gain.
Another negative is a 3 tenths downward revision to first-quarter GDP, now at a very thin plus 0.8 percent. But today’s report isn’t as bad it looks underscored by final demand which came in 2.4 percent or double the first-quarter’s rate. Low inventories are a plus for the third quarter as is the momentum underway in the economy’s central strength, the consumer.
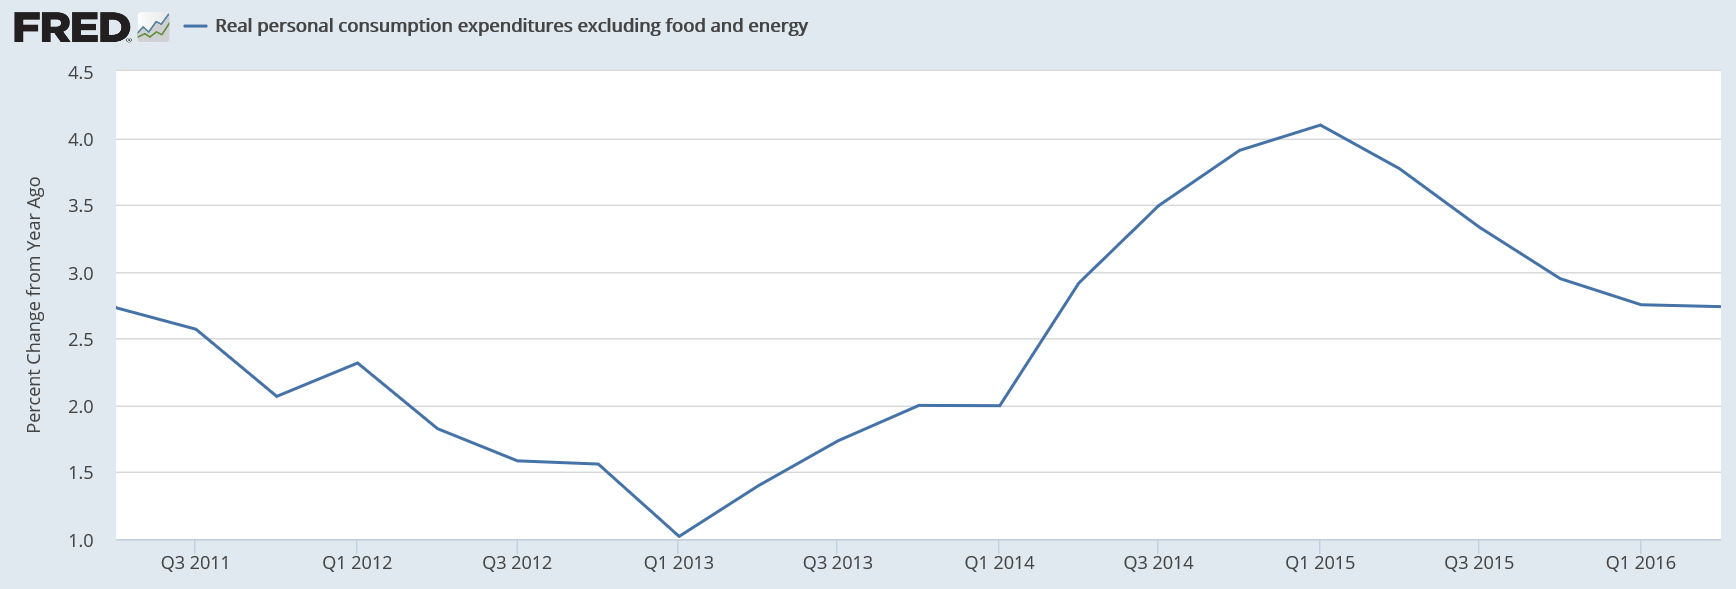
Even this ‘stellar’ part of the report is very low vs prior cycles and working its way lower on an annual basis, which tends to minimize any seasonal factors:
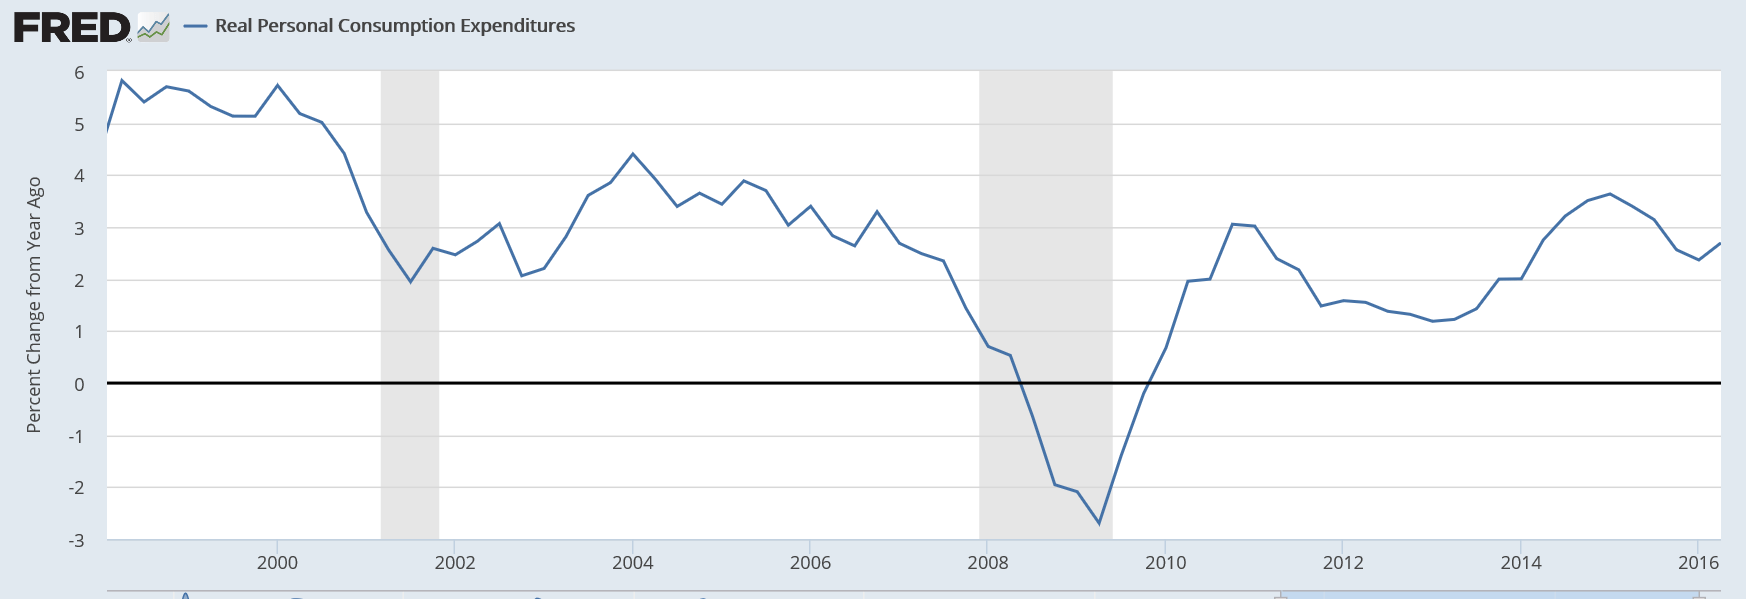
And energy prices were what made it go up instead of down:
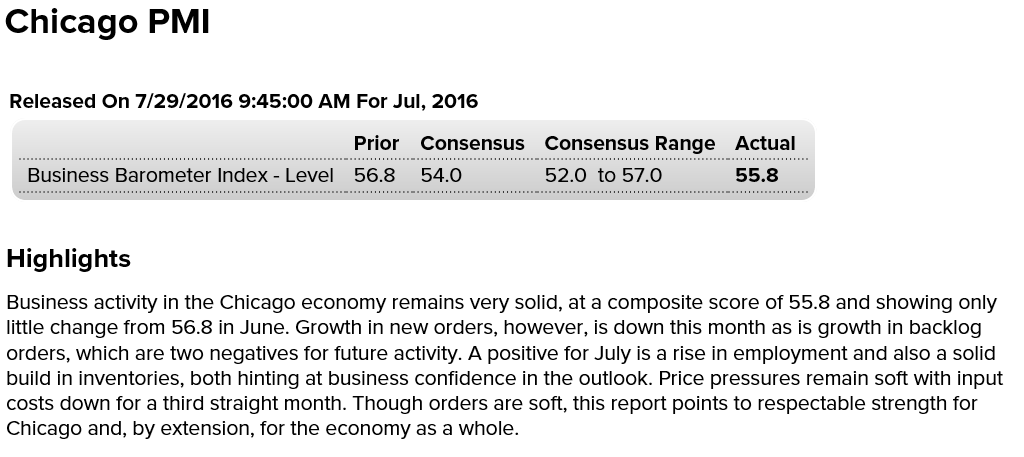
Down from last month, but a bit better than expected. New orders and backlogs soft, and the inventory build is more likely a sign of soft sales. And as the chart shows, it softened after the drop in oil capex and has yet to recover:
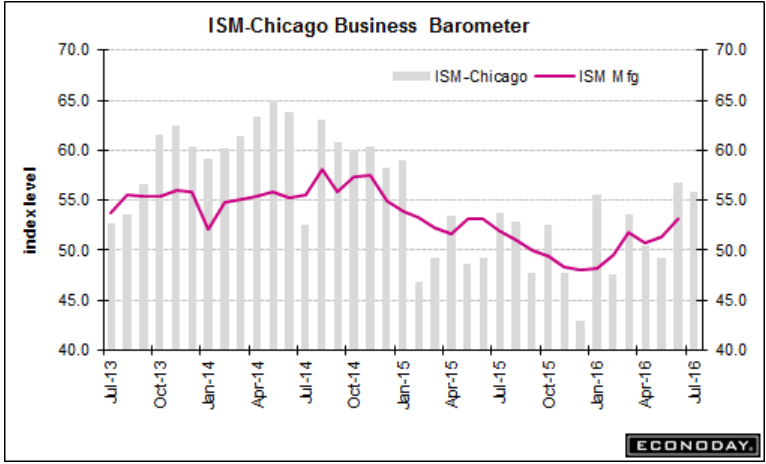
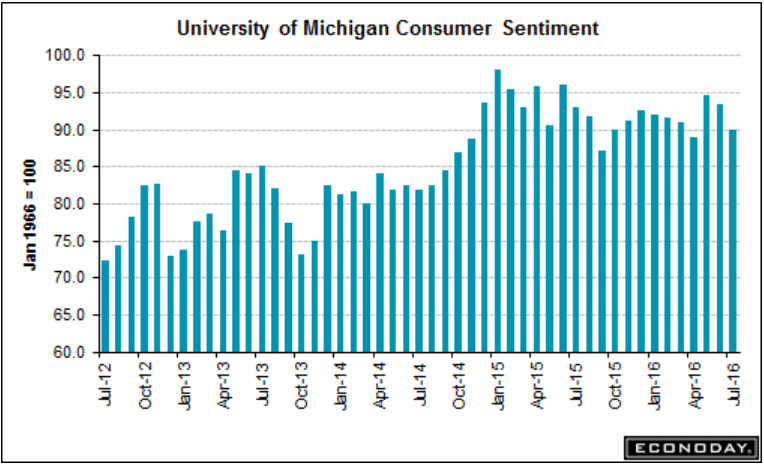
More evidence of the softening consumer extending into Q3. as the spike up a couple of months ago is now pretty much reversed. And, as previously discussed, this survey is one man one vote,
not one $ one vote, so with the fall in gas prices it’s likely to be overstating confidence: