A bit less than expected- nothing to cause the Fed to be alarmed. You’d think that by now they’d realize that all that rate cutting and so called ‘money printing’ has nothing to do with the price level or ‘accommodation’…:

Highlights
Price pressures evident the last two months down the supply chain are not yet appearing in consumer prices where the CPI rose only 0.2 percent in June for a weak year-on-year rate that is not going in the right direction, at plus 1.0 percent vs 1.1 percent in the prior three months. Ex-food & gas, consumer inflation also rose 0.2 percent with this year-on-year rate moving 1 tenth higher to a respectable but still soft 2.3 percent.
Strength in service prices was a highlight of yesterday’s producer price report and is also a highlight in this report, up 0.3 percent for the third straight month. This gain helps offset weakness in commodity prices which rose only 0.1 percent. Lodging away from home shows an outsized gain for a second month, at plus 0.6 vs May’s 0.7 percent, though housing overall is flat at only plus 0.2 percent. Transportation rose 0.6 percent in the month with medical care up 0.4 percent, gains offset by a 0.1 percent decline for food and a 0.4 percent dip for apparel.
Energy prices rose 1.3 percent in the month and follow similar gains in the four prior months, pressure reflecting the pass through from the manufacturing and wholesale sectors. For consumer prices in general, however, this effect is still limited, yet today’s report does show some signs of new life and may boost confidence among policy makers that the inflation picture is improving.
Pretty large downward revision to last month, when the larger than expected increase was taken as evidence of a recovery. If this revised number had been reported last month it would have been taken as a setback. Watch for that to happen again with this month’s larger than expected increase, and I’ll be watching next month to see if it’s also revised.
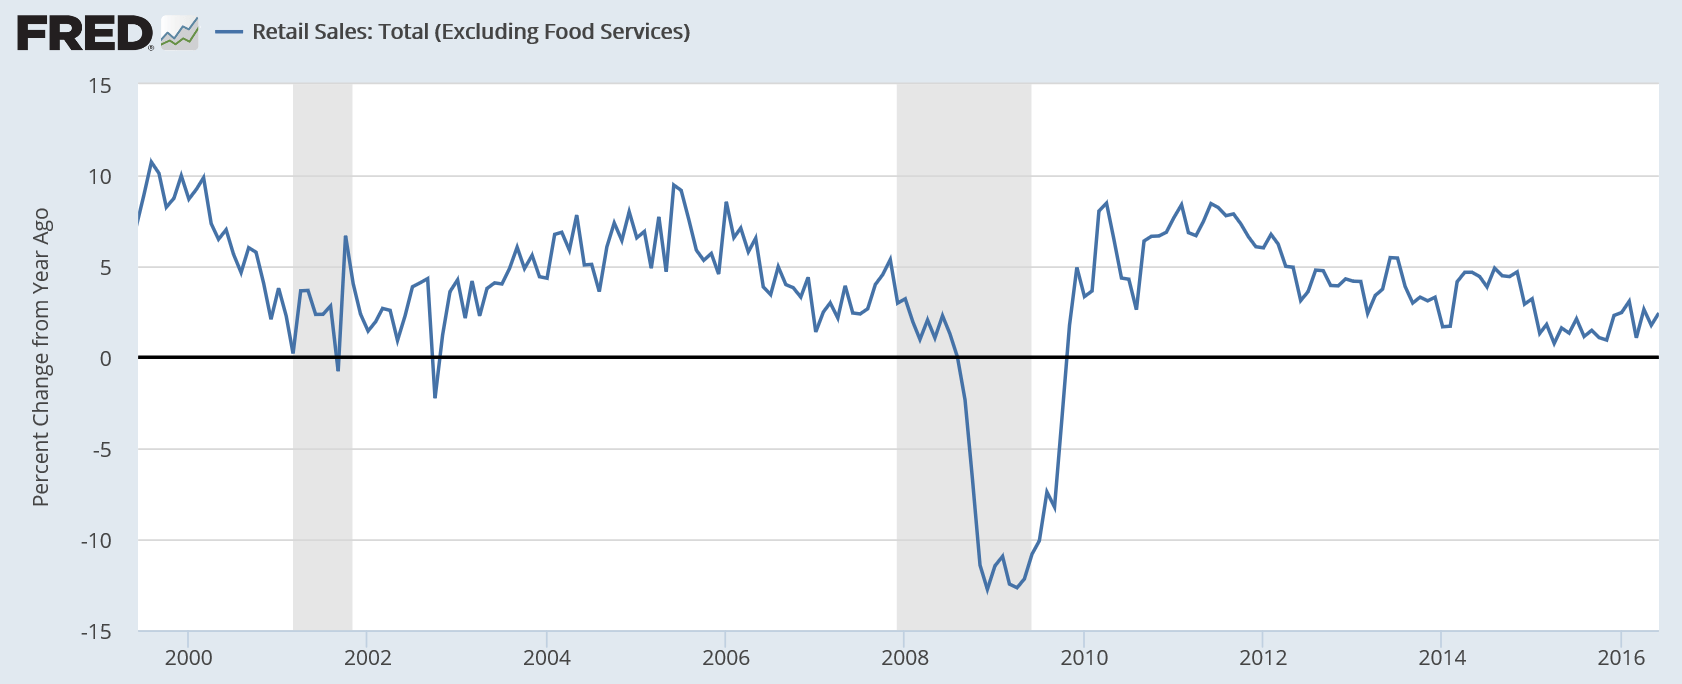
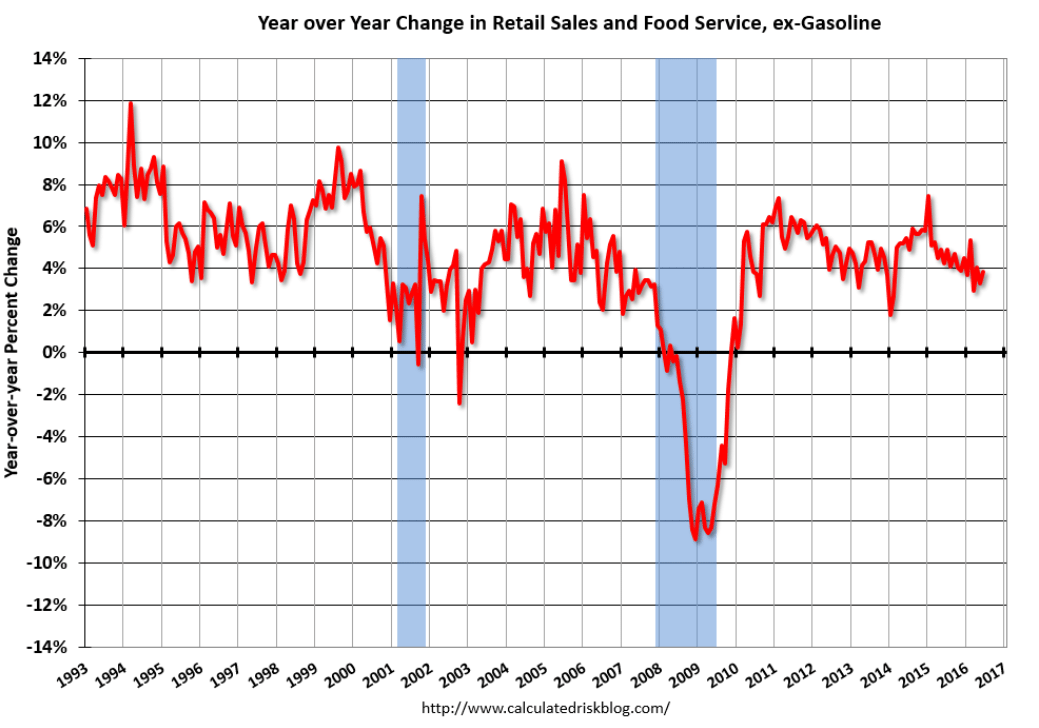
Also, note that the year over year chart continues to show severely depressed levels of growth and no sign yet of material improvement:

Highlights
June proved a fabulous month for the consumer though May, after revisions, proved only so so. Flat vehicle sales could not hold back retail sales which jumped a much higher-than-expected 0.6 percent in June, with May revised however 3 tenths lower to plus 0.2 percent. Excluding vehicles, June retail sales surged 0.7 percent as did the key ex-auto ex-gas reading.
Ex-auto ex-gas offers a gauge on underlying trends in consumer spending, a dominant one of which is ecommerce as nonstore retailers popped a 1.1 percent surge in the month which follows even stronger gains in prior months. Department stores, up 0.9 percent, show a big comeback in the month with sporting goods & hobbies strong for a second month. An outsized gain, one that hints at adjustment issues and the risk of a downward revision, is a 3.9 percent surge in building materials & garden equipment, a component that had been lagging.
This report is a major plus for the second-half economic outlook not to mention coming data on the second quarter (sales for April, after the second revision, are at a standout plus 1.2 percent). The job market is healthy and the consumer is alive and spending.
A setback here:

Highlights
The first anecdotal report on the factory sector for the month of July is not very promising as the Empire State index barely held in the plus column, at 0.55 vs 6.01 in June and minus 9.02 in May. New orders, after jumping to 10.90 in June, are down 1.82 in this month’s report. This combined with yet another contraction for backlogs, at minus 12.09, do not point to strength ahead for other readings. Employment is one of these readings and, after coming in at zero last month, is at minus 4.40. The workweek is also negative as are inventories which continue to contract. Price data are mixed, showing steady energy-related pressure for inputs but no life for selling prices. The factory sector has been up and down this year on a trend that is dead flat. Watch for the industrial production report coming up this morning at 9:15 a.m. ET. It will offer the first definitive data on the factory sector for the month of June.
Better than expected for the month, largely from a gain in vehicle output. However with vehicle sales sagging and down vs last year this month’s gain is likely to be a one time event:

Highlights
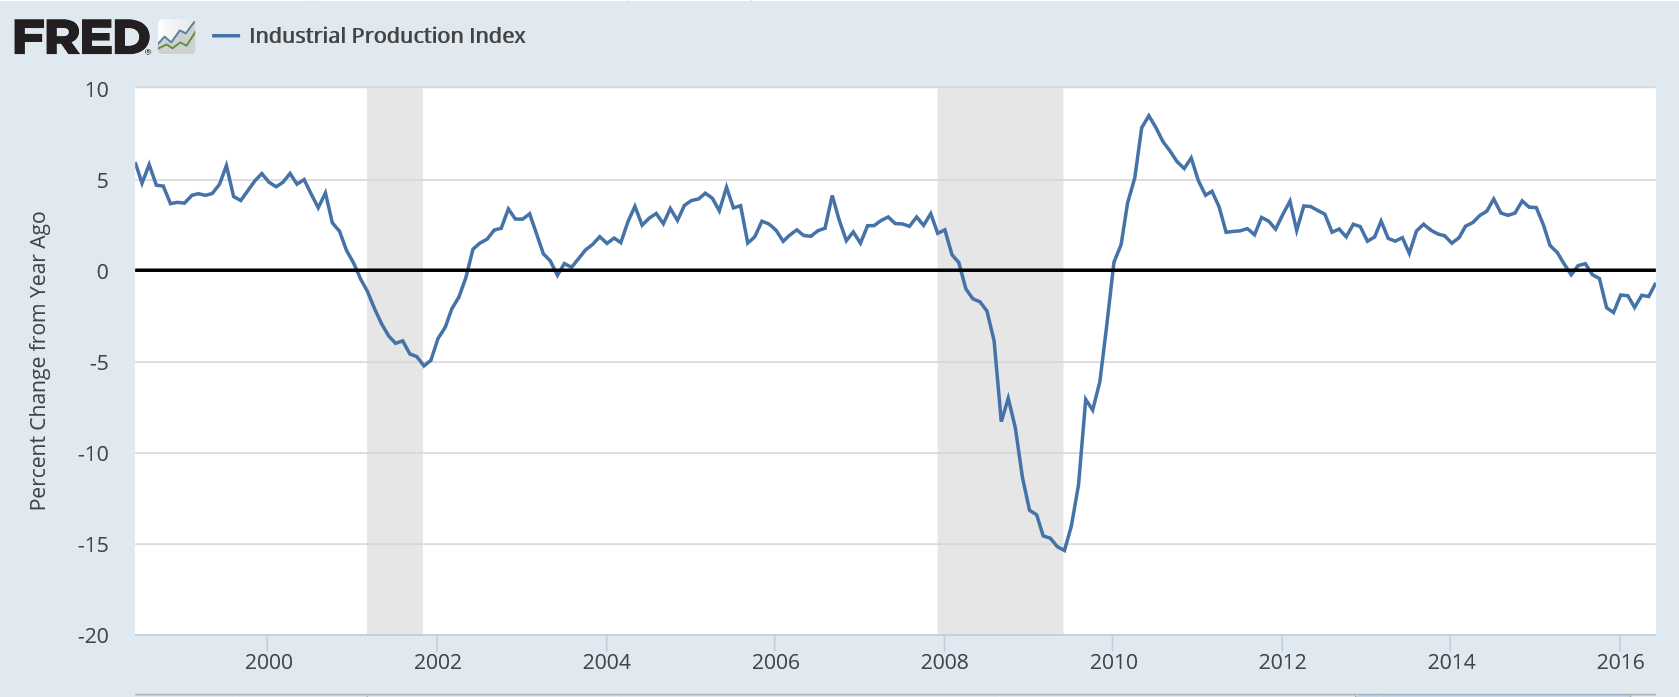
Vehicles held down industrial production in May but not in June, making for a big 0.6 percent gain that is just outside Econoday’s high-end estimate. The production of motor vehicles & parts surged 5.9 percent in June following a 4.3 percent drop in May. Year-on-year, this component tops the list with 7.8 percent growth compared to only 0.4 percent growth for manufacturing as a whole. Only due to vehicles, manufacturing managed to put in a good showing in June, up 0.4 percent on the month to reverse a revised 0.3 percent decline in May.
Headline production also got a big boost from utilities where output rose 2.4 percent in the month. Mining output, which is down 10.5 percent year-on-year, posted a second straight small gain, at plus 0.2 percent which is promising and follows the recovery in energy and commodity prices.
Looking at details deeper in the report, the output of business equipment rose a solid 0.7 percent but the year-on-year rate, in what is definitive evidence of weakness in business investment, is in the negative column at minus 0.6 percent. The output of consumer goods, up 1.6 percent on the year, rose 1.1 percent in the month in what is another good showing in this report.
The second quarter had been looking soft before this report and especially this morning’s retail sales report. A June bounce in the factory sector, facing global weakness and unfavorable currency appreciation, may not extend much into the third quarter but it may make a difference in the final readings of the second quarter.
From the Fed: Industrial production and Capacity Utilization
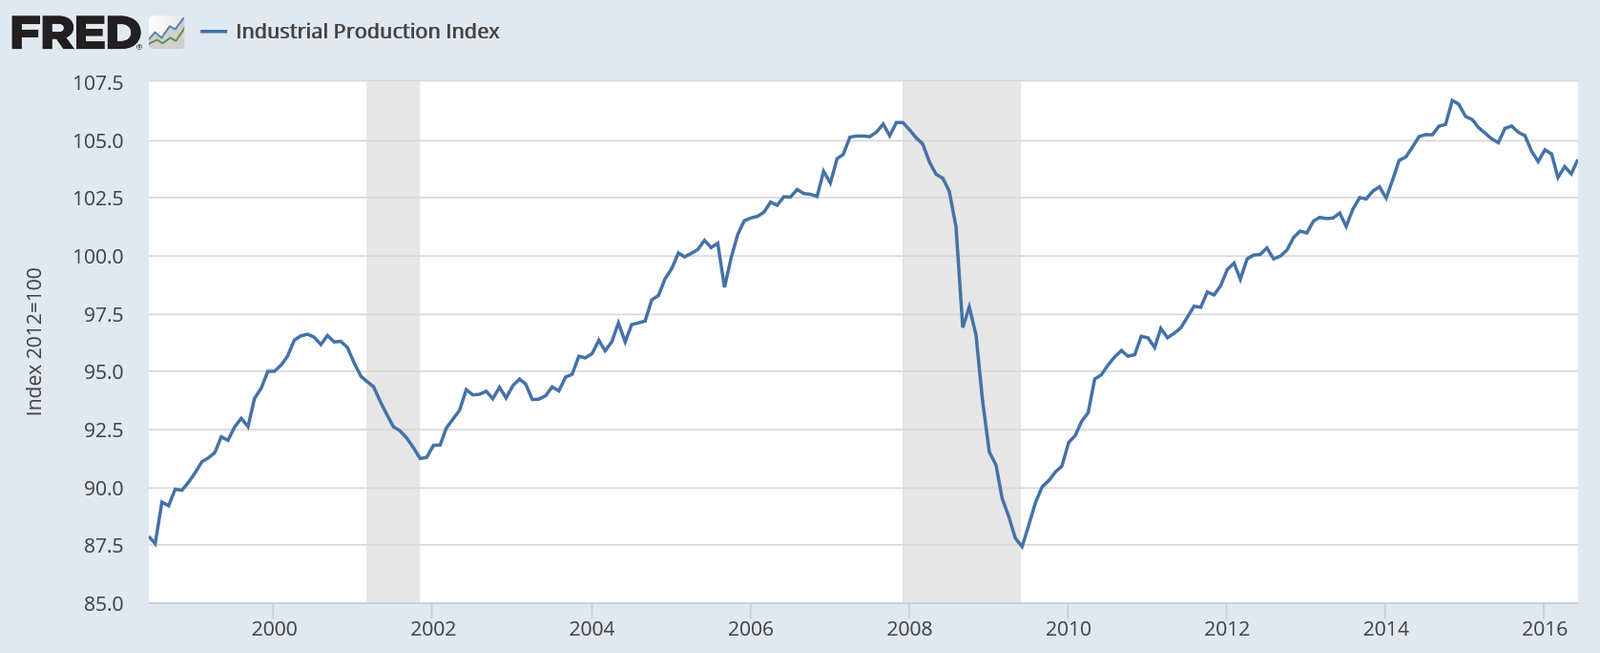
Industrial production increased 0.6 percent in June after declining 0.3 percent in May. For the second quarter as a whole, industrial production fell at an annual rate of 1.0 percent, its third consecutive quarterly decline. Manufacturing output moved up 0.4 percent in June, a gain largely due to an increase in motor vehicle assemblies. The output of manufactured goods other than motor vehicles and parts was unchanged. The index for utilities rose 2.4 percent as a result of warmer weather than is typical for June boosting demand for air conditioning. The output of mining moved up 0.2 percent for its second consecutive small monthly increase following eight straight months of decline. At 104.1 percent of its 2012 average, total industrial production in June was 0.7 percent lower than its year-earlier level. Capacity utilization for the industrial sector increased 0.5 percentage point in June to 75.4 percent, a rate that is 4.6 percentage points below its long-run (1972–2015) average.
Read more at http://www.calculatedriskblog.com/#JhY5L16LgIWsMrRf.99
You can see how weak this cycle is, particularly when compared to prior cycles. The rate of growth has been low and the total is below where it was in 2007:
Still way too high/recession levels:

Highlights
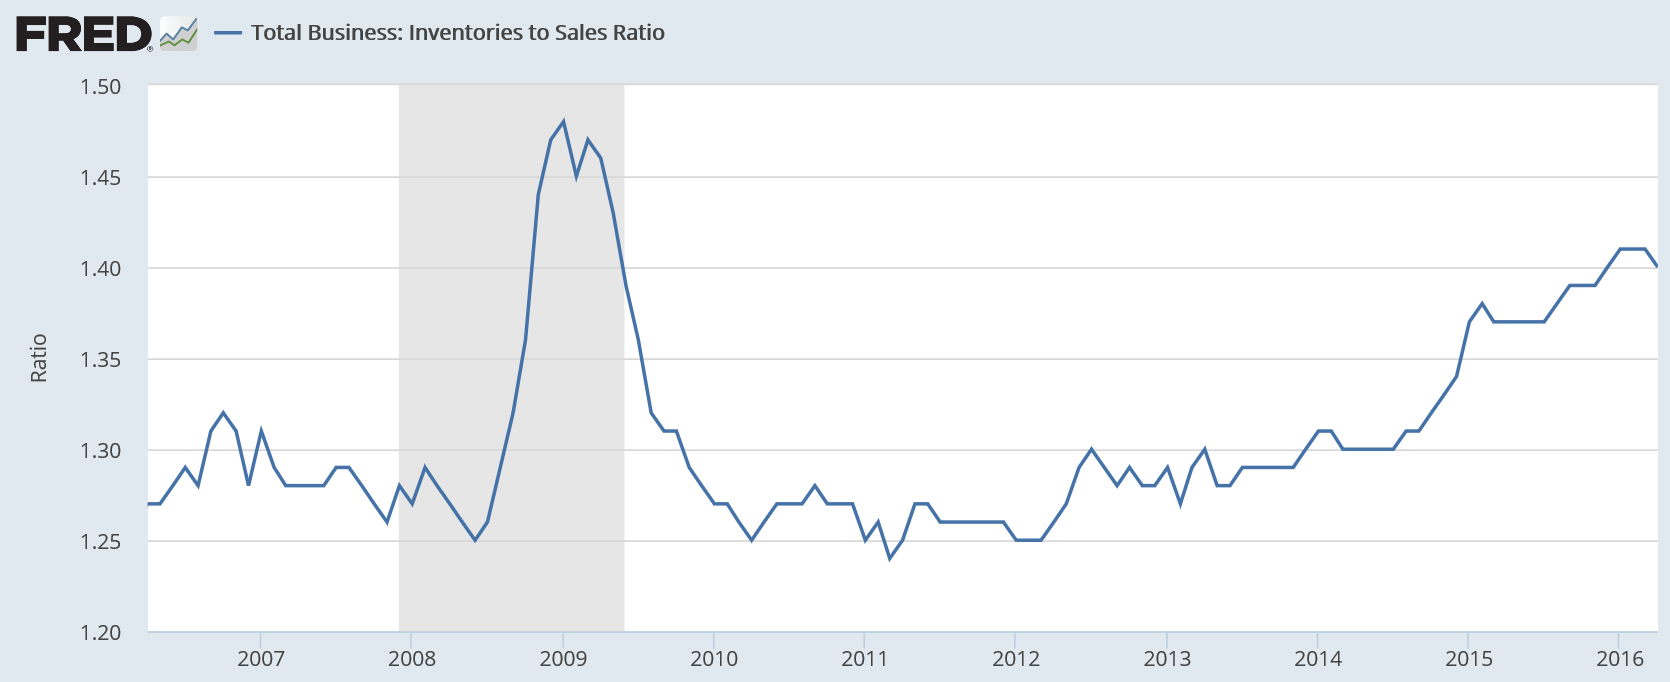
Businesses are keeping their inventories in check amid slow sales. Inventories rose only 0.2 percent in May following April’s even leaner 0.1 percent rise. Sales in May also rose 0.2 percent keeping the inventory-to-sales ratio unchanged at 1.40, which is a little less lean than this time last year when the ratio was at 1.37.
Retail inventories did rise an outsized 0.5 percent in May in a build, however, that looks to be drawn down by what proved to be very strong retail sales in June. Manufacturing inventories fell 0.1 percent in May with wholesalers up 0.1 percent.
Year-on-year, total inventories are up 1.0 percent which looks fat against what is a 1.4 percent decline in sales. With Brexit now in play, businesses are certain to keep ever tightening control over their inventories, a factor that will keep down current GDP growth but will help the outlook for employment and future GDP.
(this chart not updated yet for today’s 1.40 print)
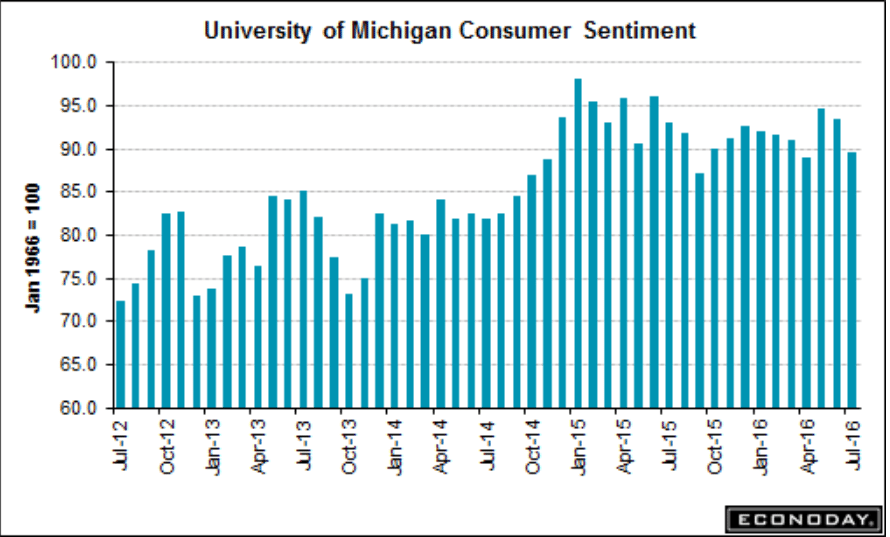
Big setback here, confirming the downtrend:

Ok, stronger than expected, but down from same quarter last year, with other banks reporting similar or worse, and overall rates of loan growth are decelerating:
J.P. Morgan Posts Stronger-Than-Expected Results on Trading Surge
By Emily Glazer and Peter Rudegeair
July 14 (WSJ) — J.P. Morgan’s second-quarter profit fell slightly from a year earlier, to $6.2 billion. Loan growth topped 10%. Revenue rose 2.4% from a year ago to $24.38 billion. The bank’s net-interest margin fell 0.05 percentage point from the prior quarter to 2.25%. J.P. Morgan’s loan portfolio grew to $858.6 billion. And total net-interest income of $11.4 billion was up 6% from a year earlier. Total consumer loans, excluding credit cards, grew by 14% to $361.31 billion. The bank’s overall provision for credit losses ballooned 50% to $1.4 billion because of reserve increases and higher net charge-offs.
Looks to me the UK can now threaten not to leave unless they get favorable terms?
;)
‘Reasonable’ that Britain wants financial services access to EU: Schaeuble
By Joseph Nasr
July 14 (Reuters) — UK Treasury Secretary Philip Hammond’s remarks that British financial services should retain access to the European Union’s single market are “reasonable,” German Finance Minister Wolfgang Schaeuble said on Thursday.
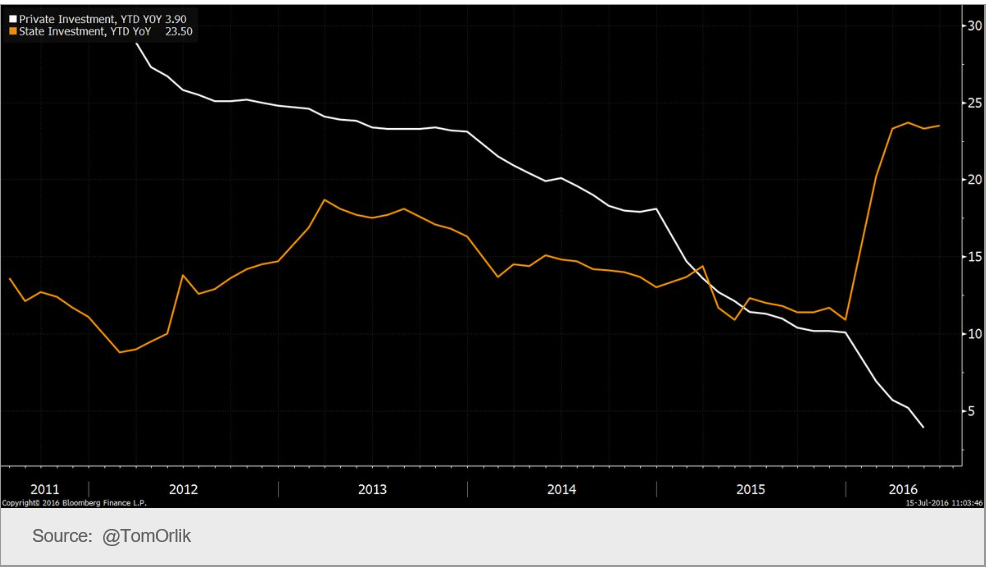
So maybe those western educated monetarists will recognize that fiscal adjustments do work…:
China Q2 economic growth beats estimates as stimulus shores up demand
July 15 (CNBC) — China’s economy narrowly beat estimates Friday with a 6.7 percent expansion on-year in the three months through June. The headline figure was steady from the previous quarter’s 6.7 percent pace. Second quarter Gross Domestic Product (GDP) was up 1.8 percent from the first quarter. The Chinese government is aiming for growth of 6.5 to 7 percent this year. For 2015, Beijing logged 6.9 percent growth. Friday’s release was the first since China tweaked its methodology of compiling data by adding research and development (R&D) spending into its calculations for GDP.
