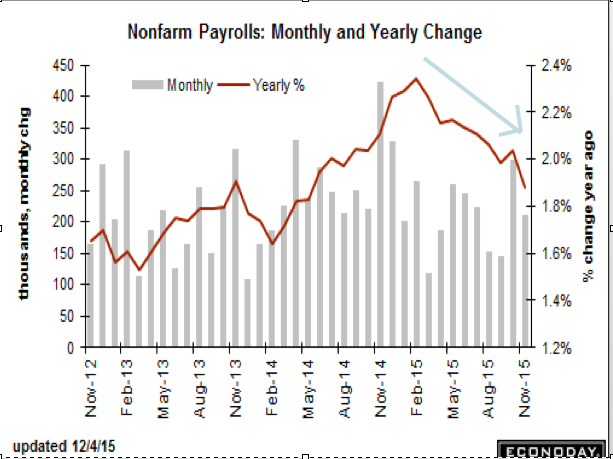
The growth rate continues to decelerate (see chart):
NFP
Highlights
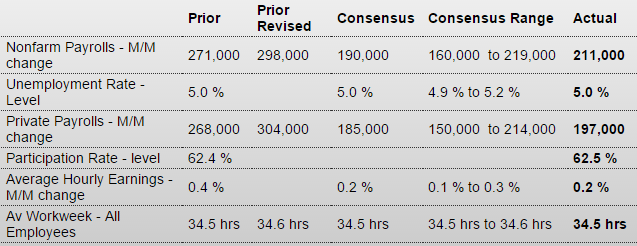
Payroll growth is solid and, though wages aren’t building steam, today’s employment report fully cements expectations for December liftoff. Nonfarm payrolls rose a very solid 211,000 in November which is safely above expectations for 190,000. And there’s 35,000 in upward revisions to the two prior months with October now standing at a very impressive 298,000. The unemployment rate is steady and low at 5.0 percent with the participation rate less depressed, up 1 tenth to 62.5 percent.
But earnings data are not impressive, up a monthly 0.2 percent vs October’s outsized 0.4 percent gain. And the year-on-year rate for average hourly earnings is down 2 tenths to 2.3 percent.
Payroll data show a 46,000 jump in construction where activity right now is very strong. This follows construction gains of 34,000 and 19,000 in the two prior months. Trade & transportation, reflecting activity in the supply chain, is also very strong with November and October gains of 49,000 and 46,000. Payrolls are also on the rise in retail trade, up 31,000 and 41,000 the last two months to indicate that retailers are gearing up aggressively for this holiday season. One negative, however, is a 12,000 dip in temporary help services which nearly cuts in half the prior month’s 28,000 gain. Demand for temporary services is considered a leading indicator for permanent hiring.
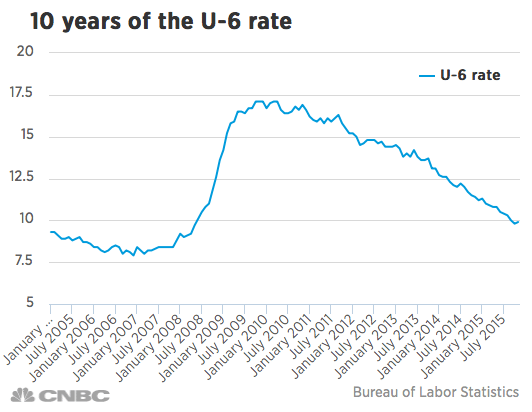
And weekly hours slipped in the month, down 1 tenth to 34.5 hours. Data on manufacturing are flat and point to little change for November production. And one negative in the report is a 1 tenth uptick to 9.9 percent for the broadly defined U-6 unemployment rate which had, however, dropped sharply in the prior months.
Despite soft spots and though earnings are flat, this report confirms that the nation’s labor market is solid and growing and, for the Fed, it supports arguments for the beginning of policy normalization.

U6 still well above pre recession levels:

Export weakness- much of it, as previously discussed, is oil related as oil exporting states cut back on spending and foreign oil capex declines as well- is beginning to dominate. Also, as previously discussed, falling US oil production and rising gasoline consumption are beginning to increasingly offset the drop in price for oil related imports.
In other words, all considered, the drop in oil prices is causing the negative trade gap to widen rather than narrow as most expected.
This makes the oil price collapse fundamentally a negative for the $US rather than a positive.
International Trade
Highlights
The nation’s trade deficit came in at the high end of expectations in October, at $43.9 billion with details reflecting oil-price effects but also soft foreign demand. Exports fell 1.4 percent in the month while imports, pulled down by oil, fell 0.6 percent. The decline for goods exports, at 2.5 percent, is in line with last week’s advance data but not for imports where goods declined 0.6 percent, vs the advance reading of minus 2.1 percent. Exports of services are once again solid at plus 0.7 percent.
Low prices for oil held down imports of both crude and industrial supplies. Imported crude averaged $40.12 per barrel in the month vs $42.72 in September and, in a reminder of the commodity price collapse, vs $88.47 a year ago. Turning to finished goods, however, imports do show gains with capital goods up as well as autos and consumer goods. Country data show a narrowing with China to $33.0 billion, which ends five straight months of widening, and a widening with the EU to $13.4 billion.
This report is mixed, confirming weakness abroad but showing some life at home. But, with exports down, the data do point to a slow start for fourth quarter GDP.

