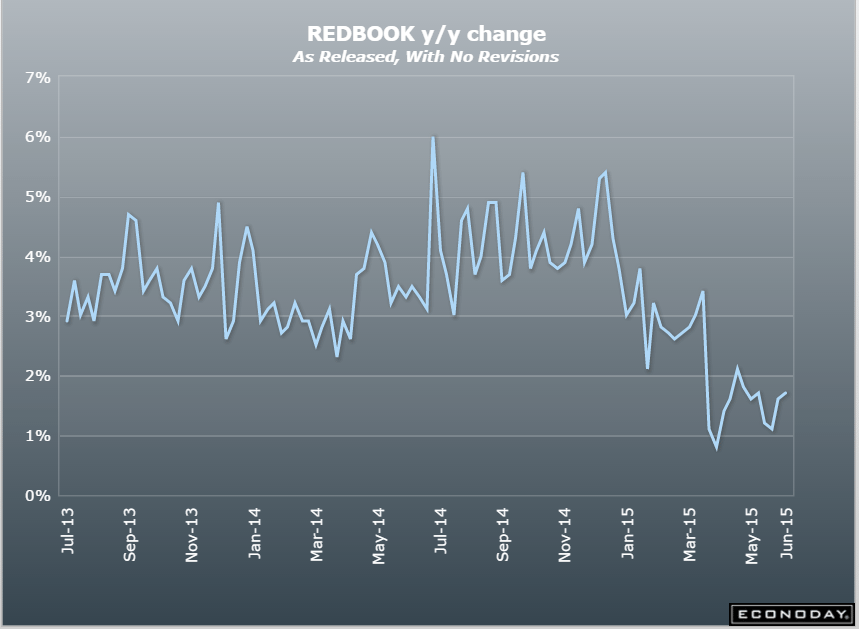
This measure of retail sales remains surprising depressed, even to me:
United States : Redbook
Highlights
Redbook’s sample continues to report stubbornly low sales rates, at a same-store year-on-year plus 1.7 percent in the June 27 week. Month-over-month, Redbook’s call is a sharp 1.5 percent contraction for June in what is a negative signal for the government’s core ex-auto ex-gas reading. The report says sales following Father’s Day were depressed though retailers expect to see strength going into the July 4 holiday. This report, which first swung lower in March, did not pick up the strength in May and is not likely to shape forecasts for June.
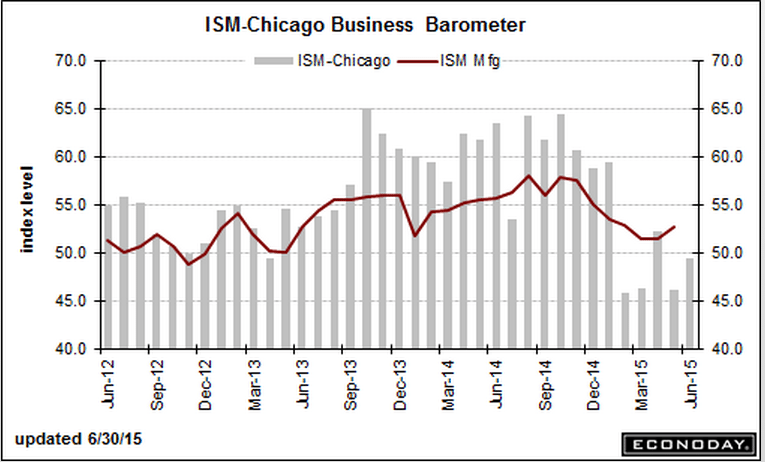
And another bad one:
Chicago PMI
Highlights
Chicago’s PMI sample remains surprisingly depressed, at a June index of 49.4 which is noticeably below the Econoday consensus for 50.6. June is the 4th contractionary reading (sub-50) of the last five months.
The sample’s employment is the lowest since November 2009 with backlog orders the lowest since September 2009. Note that weakness in backlogs is a clear negative for future employment. Production, like the main index, is in contraction for the 4th time in five months.
But leading the positive side of the report are new orders which are now back above 50. And in a special question, respondents are cautiously optimistic that new orders will begin to pick up in the third quarter
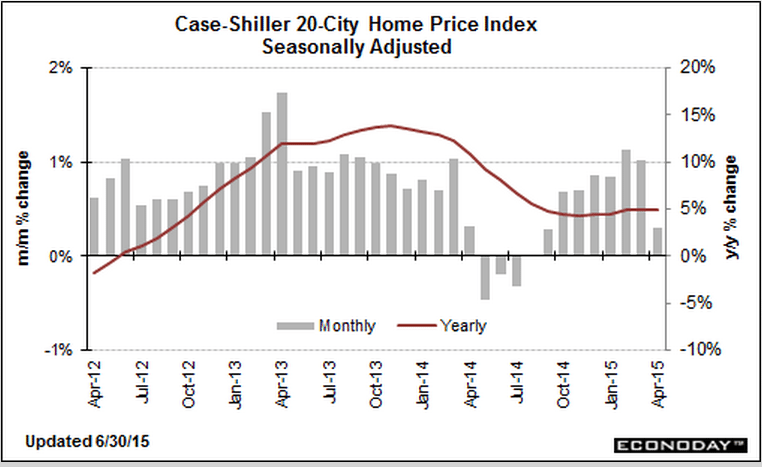
Also below expectations and decelerating:
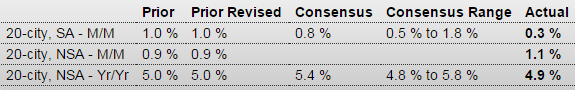
S&P Case-Shiller HPI
Highlights
Growth in home prices slowed sharply in April, up only 0.3 percent for Case-Shiller’s 20-city index which is 5 tenths below Econoday’s consensus and 2 tenths below the low forecast. The year-on-year rate, at plus 4.9 percent, is 5 tenths below the consensus and 1 tenth above the low end.
For the first time since all the way back in September, minus signs suddenly appear on the city breakdown list with 8 of 20 cities showing contraction in April. Cleveland shows the sharpest monthly contraction at minus 0.5 percent followed by Atlanta and Chicago at minus 0.4 percent each.
But several on the plus side show significant strength led by Minneapolis at a monthly plus 1.0 percent followed by Denver, Detroit and Las Vegas at plus 0.9 percent. Year-on-year, Denver and San Francisco lead the list at plus 10.3 and 10.0 percent with Dallas in third at plus 8.8 percent. Those showing the least year-on-year growth are Washington DC at plus 1.1 percent, Cleveland at plus 1.3 percent, and Boston at plus 1.8 percent.
But weakness in this report, where monthly readings are actually 3-month averages, reflects the weak sales conditions in the early part of the year, conditions which reversed strongly in May and which point to price strength for the May edition of this report. The next hard data on housing will be construction spending on tomorrow’s calendar.
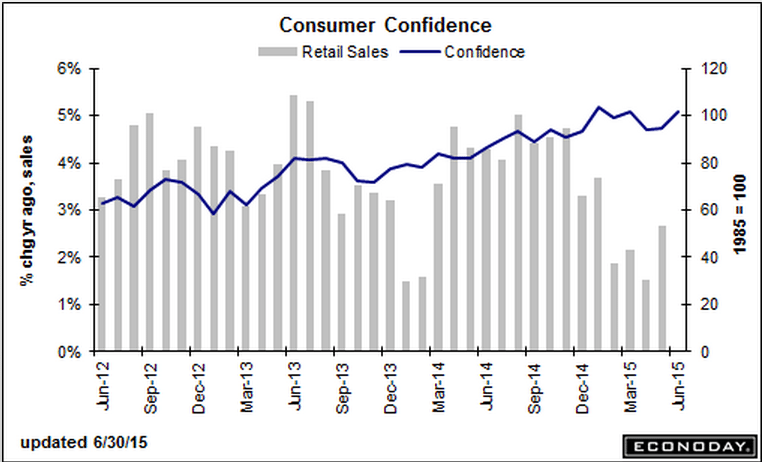
Nice pick up in confidence to get back towards Q1 levels: