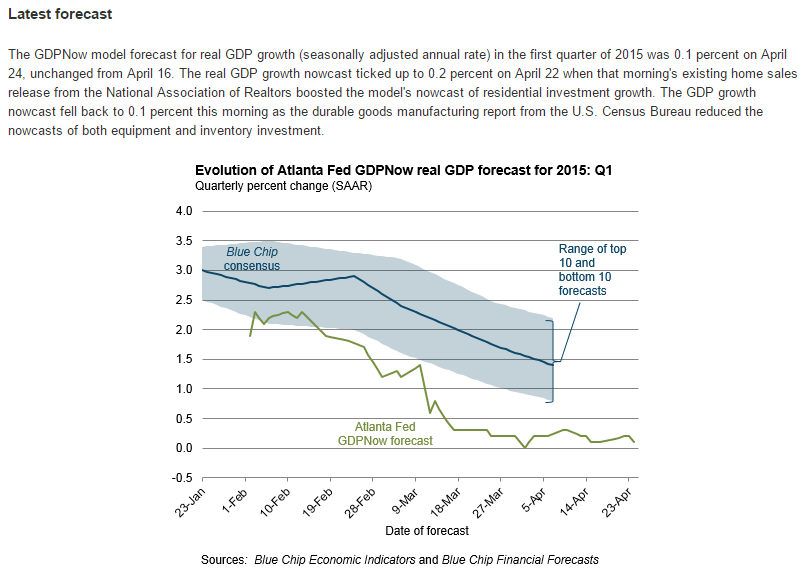
All the important indicators still heading south, and Atlanta Fed again reduces it’s GDP forecast
Durable Goods Orders
Highlights
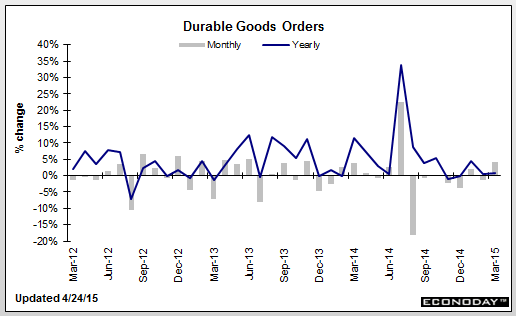
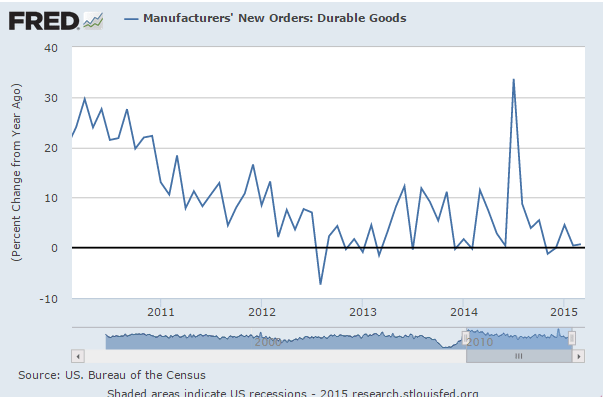
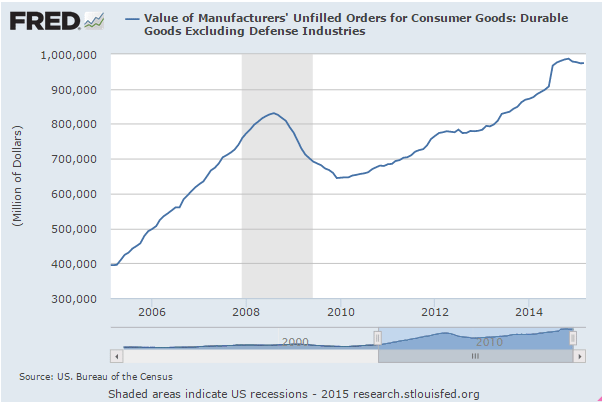
Manufacturing is on a dual track-transportation up and non-transportation soft. Durables orders rebounded 4.0 percent in March after falling 1.4 percent in February. Analysts called for a 0.5 percent increase. Excluding transportation, the core dipped 0.2 percent, following a decline of 1.3 percent in February. Expectations were for a 0.3 percent boost in March. Transportation spiked 13.5 percent after a 1.8 percent dip in February. All major transportation subcomponents gained. But the core was soft.
Within the core, orders were almost all down. The only major industry that gained was computers & electronics. Declines were seen in primary metals, fabricated metals, machinery, electrical equipment, and “other.”
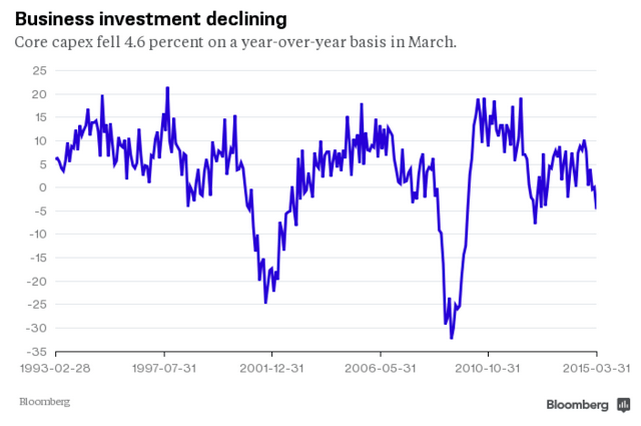
Nondefense capital goods orders excluding aircraft were down 0.5 percent, following a 2.2 percent dip in February. This suggests that businesses are being reluctant to invest in equipment and that business equipment investment will be soft in coming quarters. Shipments of this series declined 0.4 percent in March after slipping 0.1 percent the month before. This likely will cut into first quarter GDP growth estimates.
The manufacturing sector continues to be weak outside of transportation. This is another indicator that points to a soft first quarter and continued Fed ease. The Fed likely will continue to see the manufacturing sector as soft and not be in a hurry to raise rates.
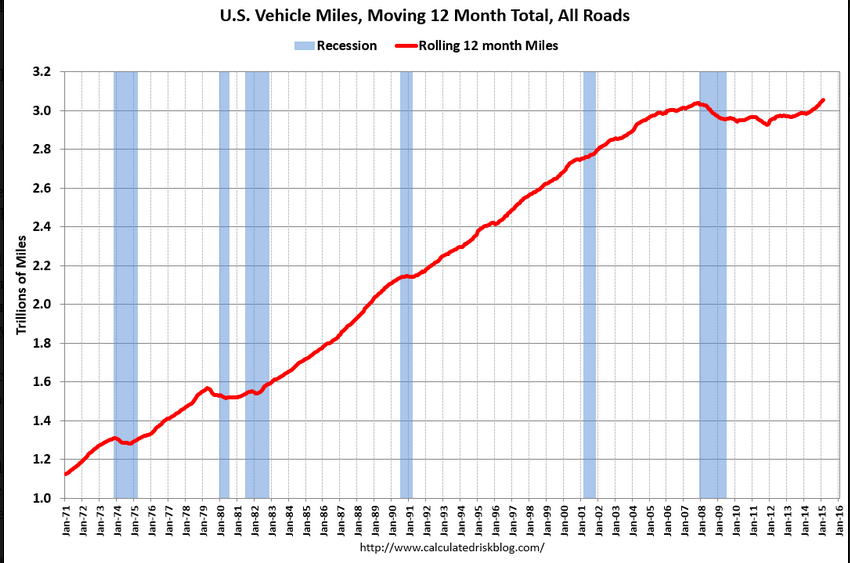
Yes, this estimate of the 12 month total hit an all time high, but the chart shows how weak it remains, and the general weakness of this recovery (not that driving more is a ‘good thing’) and it’s not population adjusted. And Feb did print lower than Jan:
DOT: Vehicle Miles Driven increased 2.8% year-over-year in February, Rolling 12 Months at All Time High
By Bill McBride
The Department of Transportation (DOT) reported:Travel on all roads and streets changed by 2.8% (6.1 billion vehicle miles) for February 2015 as compared with February 2014.
Travel for the month is estimated to be 221.1 billion vehicle miles
The seasonally adjusted vehicle miles traveled for February 2015 is 254.1 billion miles, a 2.6% (6.4 billion vehicle miles) increase over February 2014. It also represents a -1.2% change (-3.2 billion vehicle miles) compared with January 2015.
