
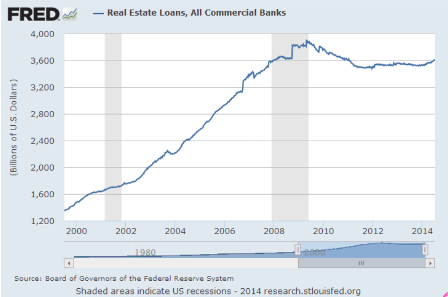
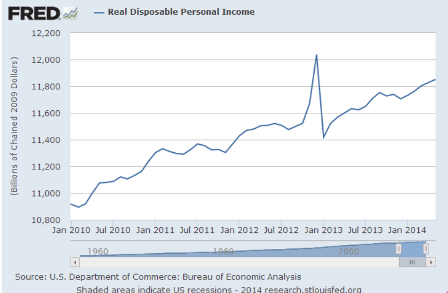
Maybe just a bounce from a dip/shift from/to bank lending. We’ve been here before and turned down. And in the last cycle growth was much higher and lagged the end of the cycle:
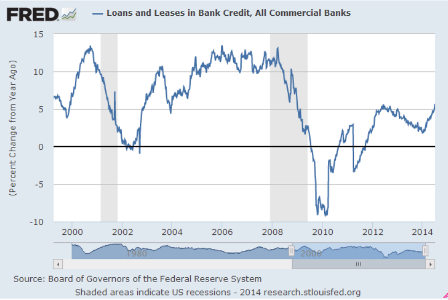
Full size image
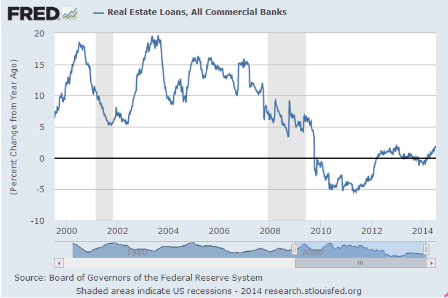
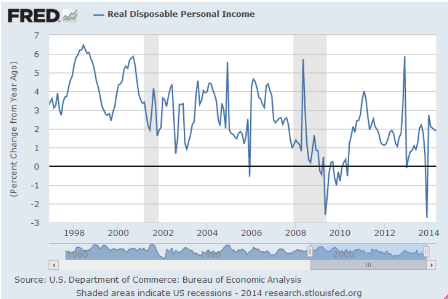
Year over year- a relatively small blip up at the end, but in general looks boring to me:
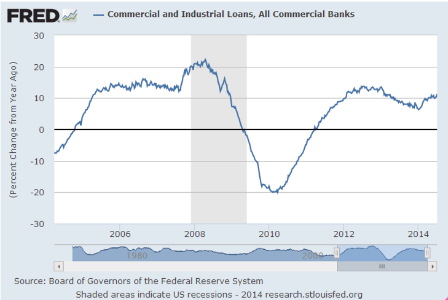
Full size image
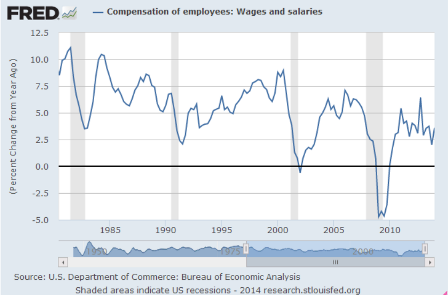
Same here. The latest blip up looks like just a bit of vol.
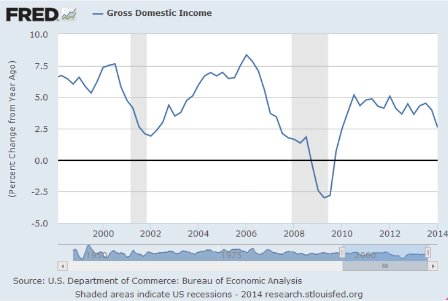
And also note that it tends to go up before a recession?
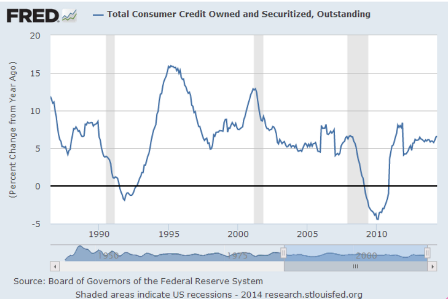
Full size image
Full size image
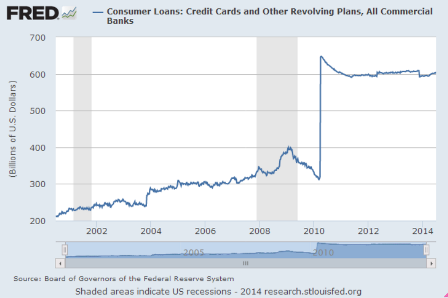
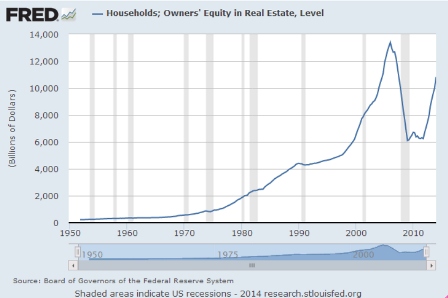
Not much happening here, either:
Full size image
Full size image
Full size image
Full size image
Seems to be a macro constraint on income:
Full size image
Full size image
Full size image