I’m starting to believe my own narrative…
;)
Soft for the winter, up some, then moderating again.
All under the ongoing macro constraint of aggressive automatic stabilizers that brought the deficit down even with a negative GDP quarter, and some degree of path dependency with weakness taking something away from subsequent periods.
Not to mention the story about 1.2 million who lost benefits at year end taking menial jobs, boosting headline employment, not adding to personal income as their pay was about the same as the lost benefits, and front loading job growth as ultimately more headcount isn’t a function of benefits lost. We’ll see.
And a world getting tougher to export to. Weaker CNY isn’t helping, for example.
First, another firm revises Q1 down further, and Q2 up some as well:
GOLDMAN: “… we are taking our tracking estimate for Q1 [GDP] down to -1.9% [and] raising our tracking estimate for Q2 by 0.3pp to 3.8%”
If these turn out to be correct, it implies H1 GDP will come in under 1%, and also implies 2014 somewhere around 2% of H2 can print over 3%.
The fiscal noose tightens. If the deficit is going to average 2.8% of GDP for the year and started higher than that and has been coming down, it means it’s running lower than that ‘instantaneously’- maybe around 2% of GDP or so:
Treasury: Budget Deficit declined in May 2014 compared to May 2013
By Bill McBride
June 11 (Calculated Risk) — The Treasury released the May Monthly Treasury Statement today. The Treasury reported a $130 billion deficit in May 2014, down from $138 billion in May 2013. For fiscal year 2014 through May, the deficit was $436 billion compared to $626 billion for the same period in fiscal 2013.
In April, the Congressional Budget Office (CBO) released their new Updated Budget Projections: 2014 to 2024. The projected budget deficits were reduced for each of the next ten years, and the projected deficit for 2014 was revised down from 3.0% to 2.8%. Based on the Treasury release today, I expect the deficit for fiscal 2014 to be lower than the current CBO projection.
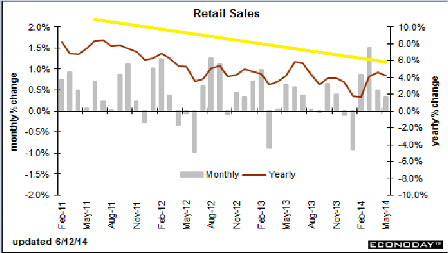
Retail sales showing the down for the winter, up, then lower growth pattern, in the context of the longer term drift lower in growth:

Full size image
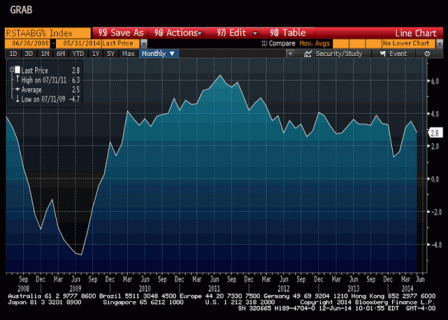
The retail sales ‘control group’ (ex food, autos, building materials, and gas stations) shows the same pattern even more clearly:

Full size image
Lastly, keep an eye on crude prices. Looked to me like the spike in 2008 might have been the catalyst for the collapse in demand…
