
Charts that Say Demand Isn’t Doing Much of Anything
Yes, there’s modest top line growth, but not a lot of evidence anything more than that is likely to happen any time soon, especially with global post earthquake issues, US fiscal cutbacks of at least $31 billion as a ‘down payment’ next week, Japan showing no inclination to rebuild without ‘paying for it’, UK austerity kicking in for real this month, continued tightening in the euro zone, and China still fighting inflation with spending and lending cuts.
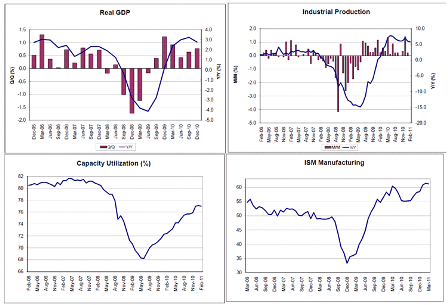

Q1 GDP now forecast with a 2 handle, and manufacturing, though sort of strong, is only about 11% of GDP and considerable slack remains.
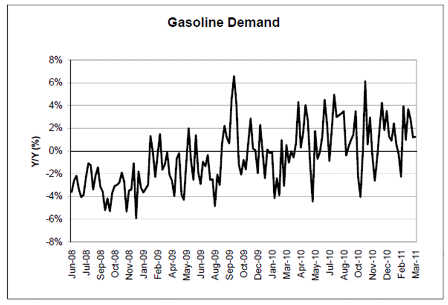
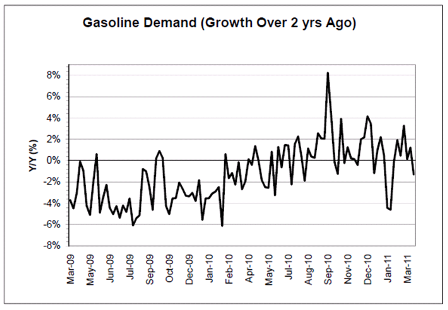
Given the more than 2 years of positive headline GDP growth, gasoline demand, previously a pretty good coincident indicator, is looking pretty flat.
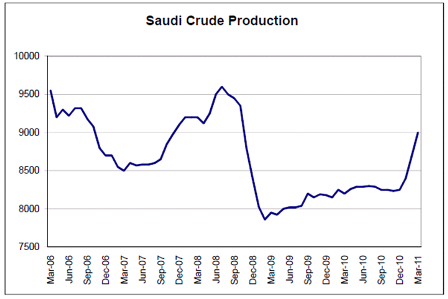
Saudi crude production has been increased to make up for lost Libyan output, and not due to an increase in world demand.
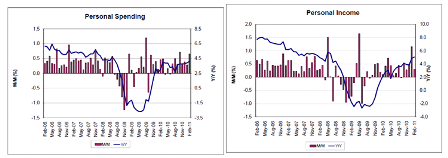
These series are doing ok, but no sign of accelerating demand. In fact the growth rates are less than they were when the output gap was a whole lot smaller in 06 and 07.
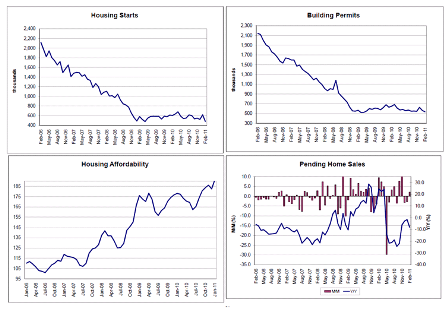
No sign of demand picking up here.
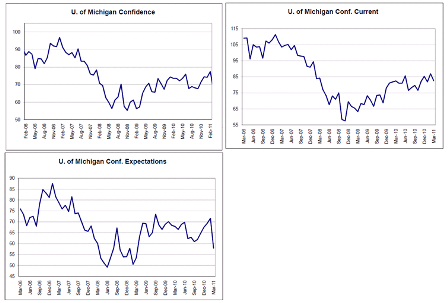
Consumer buying plans don’t look inspiring either, which makes sense with rising food and fuel prices.
With ‘normal’ credit conditions, govt deficits would be plenty high for us to be doing a lot better than this by now.
So given today’s credit conditions, seems to me govt deficits are far too small to see much progress on the demand side, and tightening fiscal at this point only makes that more so.