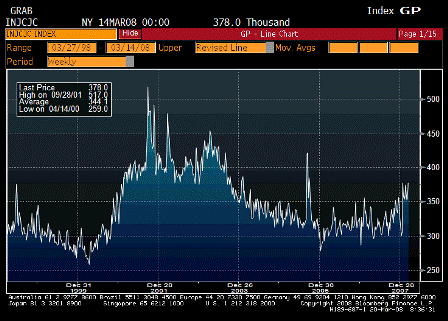
Initial Jobless Claims (Mar 15)
| Survey | 360K |
| Actual | 378K |
| Prior | 353K |
| Revised | 356K |
This has been trending higher but still not at recession levels.
(This series is not population adjusted so an upward drift over time is neutral.)
The American Axle strike also had some impact that will be reversed.
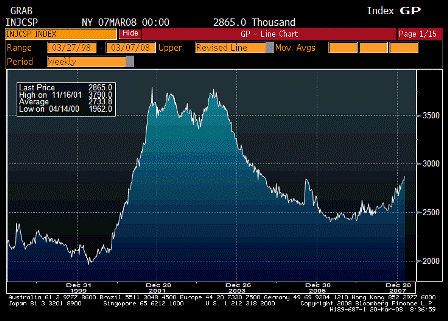
Continuing Claims (Mar 8)
| Survey | 2840K |
| Actual | 2865K |
| Prior | 2835K |
| Revised | 2833K |
This series is also not at recession levels but is a lagging indicator.
It shows the job situation has been weakening since Q3.
This is what export economies tend to look like – labor markets always have a bit of slack, and domestic consumption is relatively low as the population works, gets paid, and can’t afford to consume its own output domestically, with the balance getting exported.
And GDP muddles through.
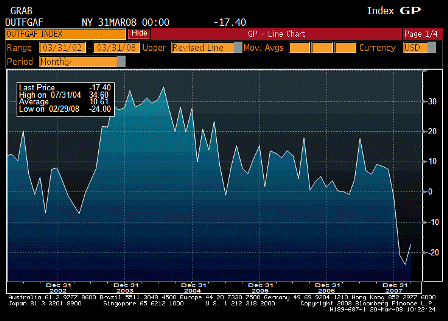
Philadelphia Fed. (Mar)
| Survey | -19.0 |
| Actual | -17.4 |
| Prior | -24.0 |
| Revised | n/a |
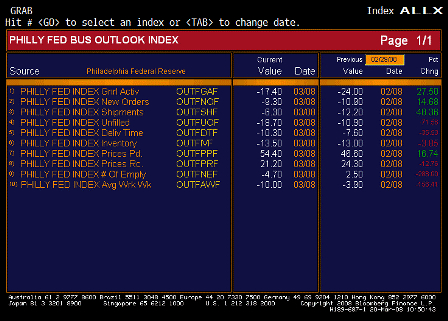
Philadelphia Fed. TABLE
Better than forecast, some improvement, but still negative numbers.
For another rate cut, numbers have to come in worse than forecast.
Prices show continuing upward pressures. Fed needs these to level off.
Karim Basta:
- Headline stays very weak at -17.4 (from -24)
- Prices paid rises from 46.6 to 54.4 but Prices received drops from 24.3 to 21.2 (margin squeeze)
- Employment drops from +2.5 to -4.7; emerging consensus of -50k drop in March payrolls
- Workweek drops from -3.9 to -10
- Special survey question on Q2 growth expectations: 0%
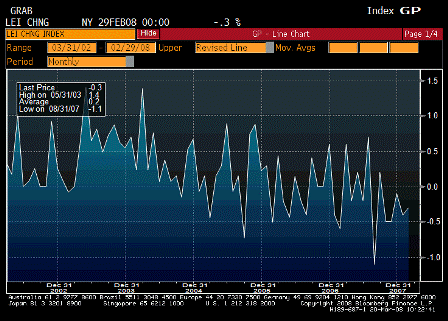
Leading Indicators (Feb)
| Survey | -0.3% |
| Actual | -0.3% |
| Prior | -0.1% |
| Revised | -0.4% |
As expected, continuing weakness.
Stock market still the most reliable leading indicator.

