- ICSC-UBS Store Sales WoW (Released 7:45 EST)
- ICSC-UBS Stores Sales YoY (Released 10:00 EST)
- Redbook Store Sales Weekly YoY (Released 8:55 EST)
- ICSC-UBS Redbook Comparison TABLE (Released 8:55 EST)
- Pending Home Sales (Released 10:00 EST)
- Pending Home Sales MoM (Released 10:00 EST)
- Pending Home Sales YoY (Released 10:00 EST)
- Wholesale Inventories MoM (Released 10:00 EST)
- Wholesale Inventories YoY (Released 10:00 EST)
- Wholesale Inventories ALLX 1 (Released 10:00 EST)
- Wholesale Inventories ALLX 2 (Released 10:00 EST)
- IBD TIPP Economic Optimism (Released 10:00 EST)
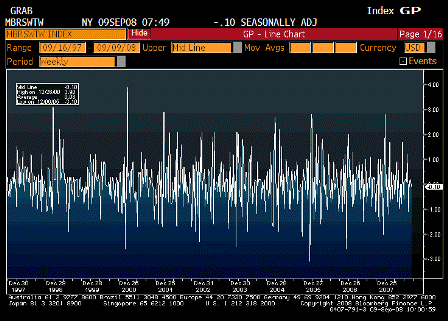
ICSC-UBS Store Sales WoW (Sep 9)
| Survey | n/a |
| Actual | -0.1% |
| Prior | 0.1% |
| Revised | n/a |
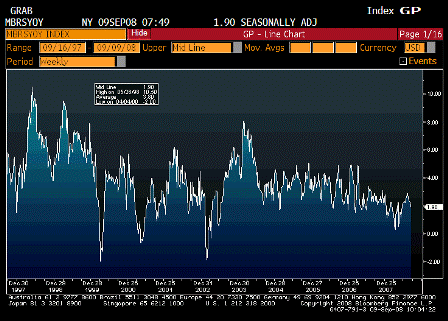
ICSC-UBS Stores Sales YoY (Sep 9)
| Survey | n/a |
| Actual | 1.9% |
| Prior | 2.0% |
| Revised | n/a |
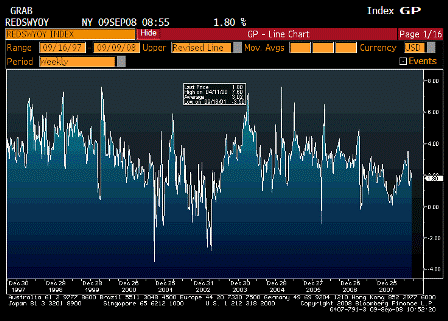
Redbook Store Sales Weekly YoY (Sep 9)
| Survey | n/a |
| Actual | 1.8% |
| Prior | 2.3% |
| Revised | n/a |
Muddling through, well off the bottom, and not at recession levels.
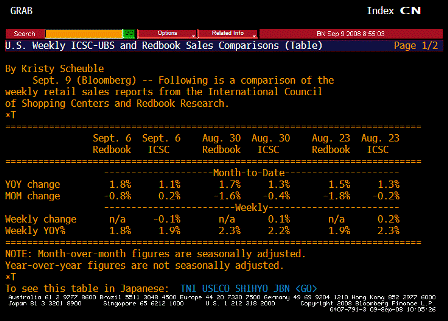
ICSC-UBS Redbook Comparison TABLE (Sep. 9)
Pretty much the same, muddling through and far from recession levels.
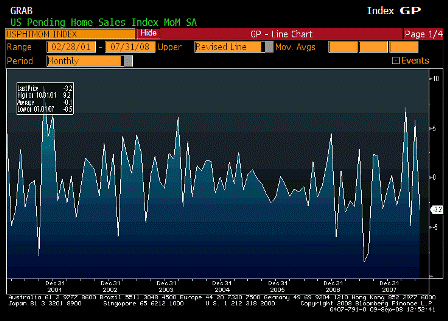
Pending Home Sales (Jul)
| Survey | n/a |
| Actual | 86.5 |
| Prior | 89.4 |
| Revised | n/a |
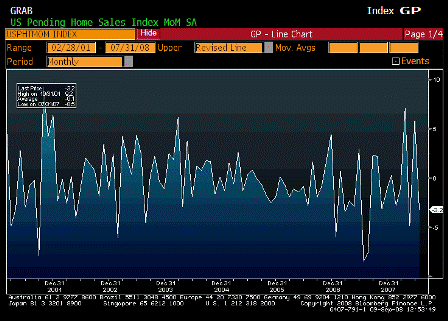
Pending Home Sales MoM (Jul)
| Survey | -1.5% |
| Actual | -3.2% |
| Prior | 5.3% |
| Revised | 5.8% |
A bit lower but last month’s gain revised even higher.
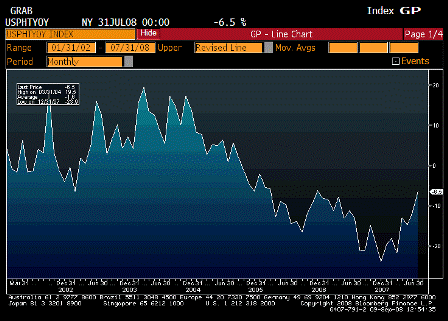
Pending Home Sales YoY (Jul)
| Survey | n/a |
| Actual | -6.5% |
| Prior | -11.6% |
| Revised | n/a |
Still negative but looks to be surfacing rapidly.
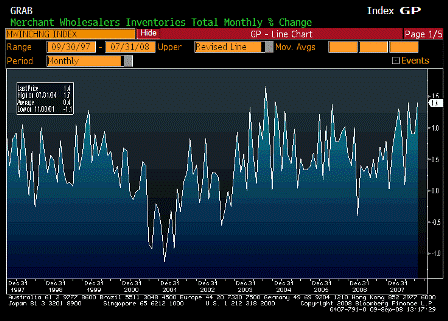
Wholesale Inventories MoM (Jul)
| Survey | 0.7% |
| Actual | 1.4% |
| Prior | 1.1% |
| Revised | 0.9% |
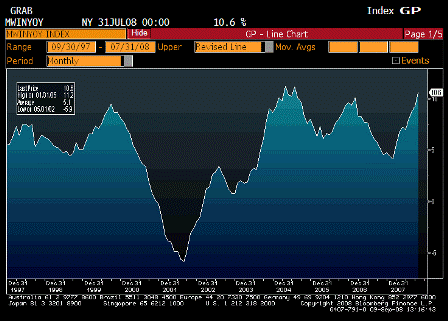
Wholesale Inventories YoY (Jul)
| Survey | n/a |
| Actual | 10.6% |
| Prior | 9.3% |
| Revised | n/a |
Inventories up but within normal fluctuations.
The question is causation- weak sales and unwanted inventories or building inventories for increasing demand
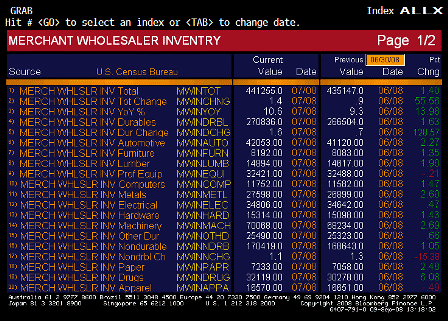
Wholesale Inventories ALLX 1 (Jul)
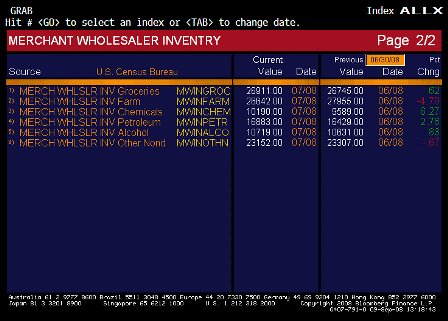
Wholesale Inventories ALLX 2 (Jul)
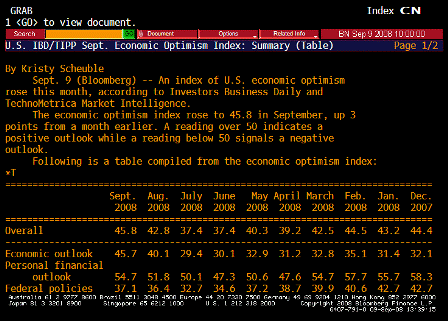
IBD TIPP Economic Optimism (Sep)
| Survey | 44.0 |
| Actual | 45.8 |
| Prior | 42.8 |
| Revised | n/a |
[top]


